
Expert Industry Insights
Get unique insights from Qube Technologies' experts to make better decisions and foster innovation.
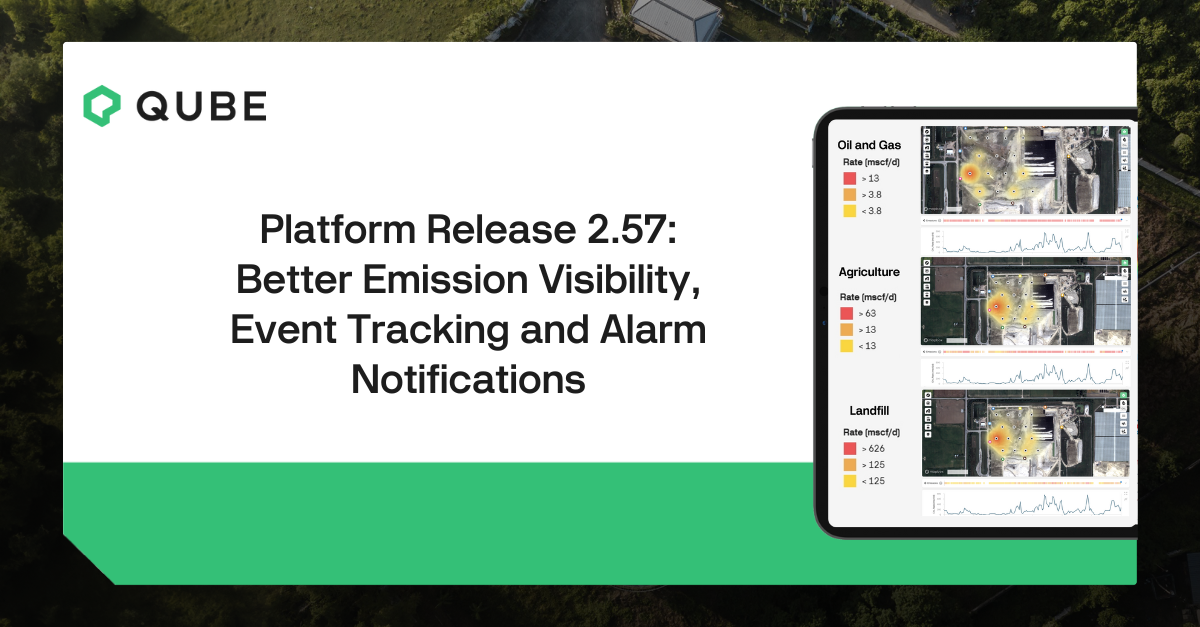
Qube Dashboard Release 2.57: Improvements to Emission Timelines, Event Log and Alarm Notifications
Release 2.57 delivers updates to the Emissions Timelines, Event Log page, and Alarm email notifications.
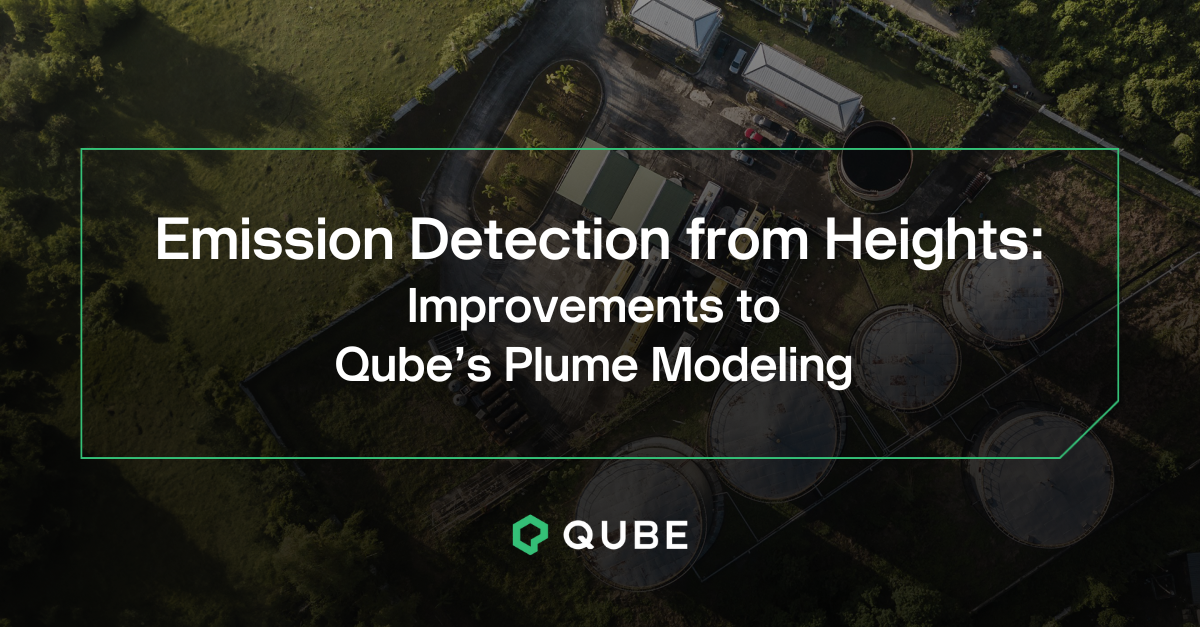
Emission Detection from Heights: Improvements to Qube’s Plume Modeling
Enhancements to Qube’s plume modeling were recently tested at Methane Emission Technology Evaluation Center (METEC) at Colorado State University. Here we show improvements to Qube’s continuous monitoring detection of methane releases at heights (i.e., storage tank tops) resulting in essentially all releases detected and quantified accurately.
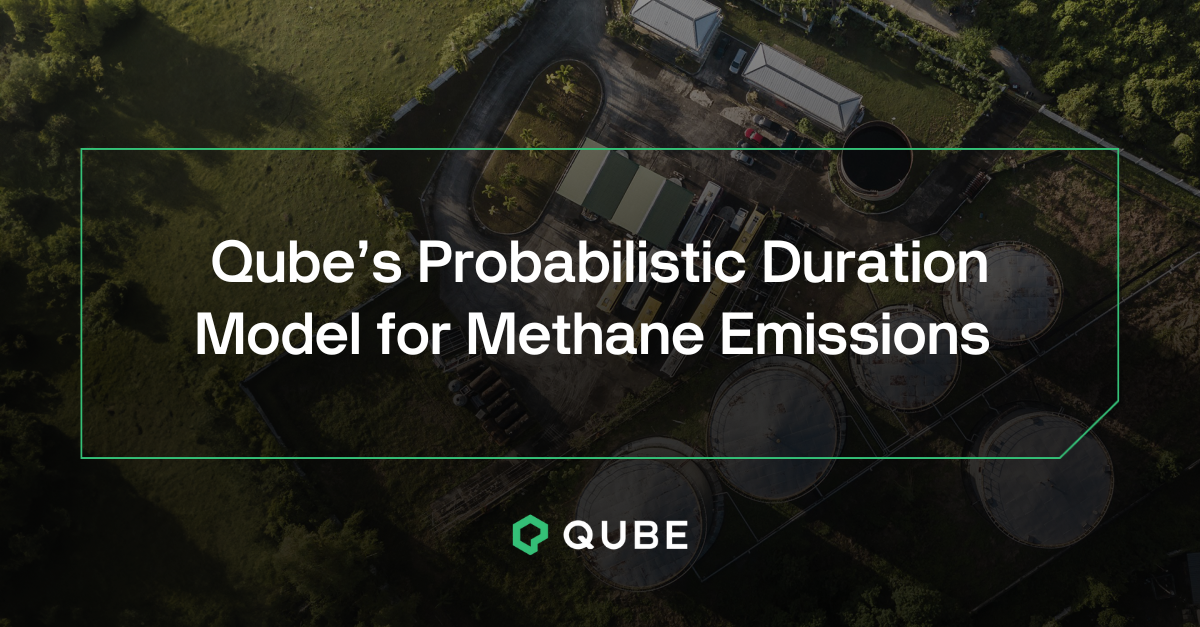
Qube’s Probabilistic Duration Model for Methane Emissions
What’s New?
Improved emission event bounding that accounts for source coverage
Source coverage is calculated based on whether devices are downwind of a particular source at a given time
We use short term probability to determine if correlation between source coverage and methane readings is coincidence or correlated
Given high enough probability, we can fill in short gaps and extend emissions
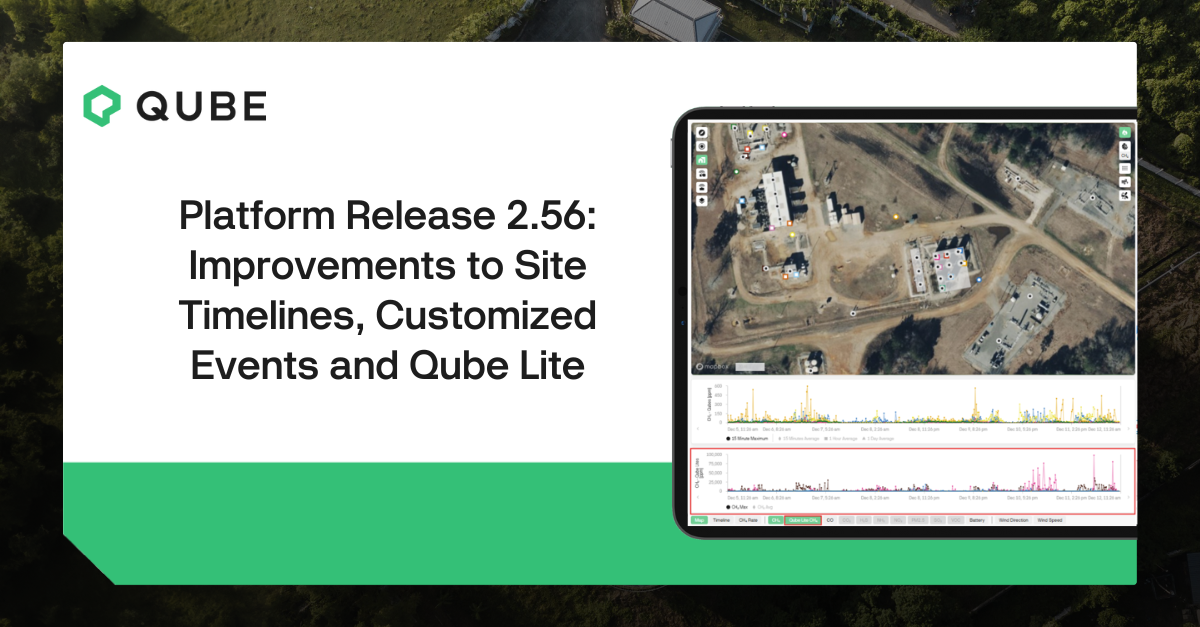
Qube Dashboard Release 2.56: Improvements to Site Timelines, Customized Events and Qube Lite
Release 2.56 brings user-created events and other improvements to the site timeline as well as better emissions visibility by Qube Lite.

Verifying Methane Reductions with Continuous Monitoring: Upgraded Pneumatic Controllers Drive 80% Reduction
Colorado’s Reg 7 requires operators to eliminate methane-emitting pneumatic controllers and prove that new systems cut emissions. This operator replaced gas-driven devices with compressed air pneumatics, then used Qube’s continuous monitoring to establish a pre-upgrade baseline and quantify performance after startup. The fenceline sensors showed an immediate, sustained methane reduction of more than 80 percent, even at sites that were already operating below baseline. For engineering and technical leaders, this project shows how continuous monitoring can validate CAPEX decisions, de-risk compliance, and create a defensible data record for regulators and internal stakeholders.

METEC ADED 2025 Results
Independent testing at Colorado State University’s METEC Advancing Development of Emissions Detection (ADED) program shows that Qube’s continuous monitoring system reliably detects the leaks that drive most methane emissions at oil and gas sites. Compared with our 2024 campaign, Qube delivered stronger performance under more demanding test conditions.
In this article we walk through the results in four areas: localization, emission rate prediction, detection capability, and quantification. We also link to the final METEC report so you can review the full third-party results.

Qube Dashboard Release 2.55: Default Filters and Alarm Notifications
Release 2.55 is here. If you manage emission monitoring for a subset of assets, this update is for you. Set your Default Filter to focus the Overview and Emission Analytics on only your sites or regions and optionally limit alarm notifications to the same filter to cut noise.

Understanding Probability of Detection and Time-to-Detection: The Continuous Monitoring Advantage
For continuous monitoring, Probability of Detection (PoD) can be framed as a function of time. Detection confidence grows with each measurement window. Here we explain how controlled-release testing and time segmentation translate PoD into Time-to-Detection (TtD) and contrast that with single-pass survey methods. For operators, this provides a practical way to set expectations for how quickly a continuous system will find different-sized events and why that matters for response.

Time-Bounding Large Release Events with Continuous Monitoring
Most LDAR methods capture only a snapshot, so they miss when an event starts, when it ends, and how long it lasts. Without that timeline, it can be challenging to quantify released volume, verify repairs, or determine whether the source is constant, intermittent, or tied to specific operations. Qube’s continuous monitoring provides 24/7 data that time-bounds emission events, enabling accurate volume estimates and confident repair verification.

Qube Dashboard Release 2.54: Enhancements to Qube Lite Functionality and Visualization
Release 2.54 is live. Operators running mixed deployments of Qube Axon and Qube Lite can now identify device type at a glance, distinguish severity faster, and tailor Qube Lite alarms to each monitored equipment. It’s improved operational awareness and faster responses.

Fewer Site Visits, Faster Repairs: Results from Qube’s EPA-Approved Periodic Screening
In March 2025, EPA approved Qube continuous monitoring as an alternative technology for periodic inspections under NSPS OOOOb/c ( and applicable to OOOOa). Here we detail how it works. Pick a 7-day window and a 90% PoD threshold. The 7-day block average either passes or fails, and crews conduct site inspections only upon fails. The results are less routine visits, faster repairs, and reduced costs across sites.

Qube Dashboard Release 2.53: Zoom In on Emission Rates and Customize Alarms at the Device Level
Release 2.53 is live. You can now zoom into low-level concentration changes and set measurement-based alarms per device for tighter, location-specific monitoring.

How Qube’s Continuous Monitoring Found Leaking Level Controllers After Well Restart
A Colorado well pad restarted after a non-routine shut-in. Within hours, Qube’s continuous monitoring flagged methane levels consistent with a large release event (estimated at >100 kg/h, about 125 mscf/d). The operator’s LDAR team located badly leaking level controllers and multiple thief hatches and completed repairs in under 24 hours. The operator then initiated a fleet-wide replacement of aging controllers to prevent recurrence.

Qube Lite Field Tested for Real-World Operations at Tourmaline’s West Wolf Lake Gas Plant
Our Product and Ops Teams installed Qube Lite at Tourmaline Oil Corp's West Wolf Lake Gas Plant as part of the NGIF Accelerator's Emission Testing Centre Program.
Qube Lite is our new intrinsically safe, lower-cost continuous monitoring sensor, designed for near-source deployment. Perfect to zero-in on individual equipment (e.g., tanks, separators, wellheads, etc.).
Initial results were positive with easy installation and seamless activation, even in less than ideal weather.

Driving Leak Detection in RNG: Case Studies from Early Deployments with Maas Energy Works
In August 2024, Maas Energy Works piloted Qube’s continuous methane monitoring at a dairy digester and saw immediate gains in leak detection and repair. On the strength of those results, Maas rolled out Qube at 24 additional digesters across California, Texas, and Idaho.
Here we present three case studies showcasing the early success of the expanded deployments. These results demonstrate Qube’s strong success in RNG, with rapid detection, verified emissions cuts, and measurable increases in retained product.

Qube Dashboard Release 2.51: Filter Quicker. Track Smarter. Arrive Prepared.
Release 2.51 is live! It brings faster site filtering, emissions source performance tracking, and capability to provide the info you need to know before arriving at site.

Qube Technologies Wins Industry Innovation Award from Western Energy Alliance
Qube Technologies is proud to receive the Industry Innovation Award from Western Energy Alliance.
The award recognizes Qube’s leadership in developing real-time methane monitoring technology for oil and gas operators. The Western Energy Alliance celebrates companies and individuals making a lasting impact on the industry across the western United States.

Maas Energy Works Expands Partnership with Qube Technologies to Monitor Biogas Operations Across Multiple States
Qube Technologies, a leader in continuous emissions monitoring, today announced an expanded partnership with Maas Energy Works (MEW) to deploy Qube’s monitoring devices across more than 20 lagoon-style digesters in Texas, Idaho, and California. Following the success of an initial pilot, MEW will now implement Qube’s real-time monitoring solution across its broader network to enhance operational visibility, reduce emissions, and optimize biogas production at scale.

Qube’s Continuous Monitoring Uncovers Blocked Vent Line: Emissions Drop 80% at Colorado Wellsite
At a Colorado wellsite, Qube’s continuous monitoring system alerted operators to a sustained emission event. Qube’s data localized the emissions to the tank area and prompted a field investigation to verify the source of the anomaly. With this information, the team was able to identify the emission source and interrogate the root cause, a blocked vent line leading to the combustor.

Qube Platform Release 2.50: Smarter Alarms & Improved Emission Analytics
Platform Release 2.50 is now live! This update delivers more user alarm control and visualized insights, leading to better operational performance.