Qube Platform Release 2.56: Improvements to Site Timelines, Customized Events and Qube Lite
With Release 2.56, you get improved event tracking, enhanced site timeline visibility, and improved tracking for emissions detected by Qube Lite.
Want to see how it works?
Add Events to the Site Timeline
Create Events on your timeline with the new User-Defined Events feature.
How to do it:
From the Site Dashboard, click on the Event Log widget.
Go to the Events tab.
Click on Add Event.
Fill out the form and click Save.
View the newly created Event on the Timeline.
Click on the event in the Event Log widget to see slide out and add comments.
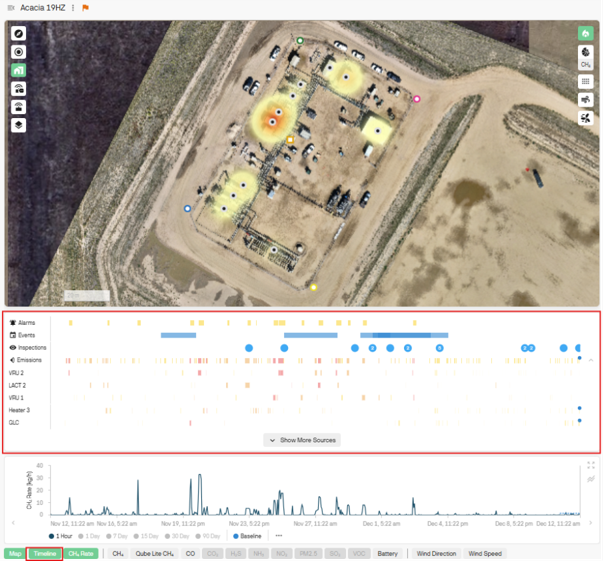
Expanded Site Dashboard Timeline
View all alarms, events, inspections and emissions in the Timeline.
Timelines only show up if there are items from those timelines within the selected time period on the Site Dashboard.
If there are multiple items underneath, like the equipment emissions timelines, then click on the “Show More Sources” button to expand and view the additional items.
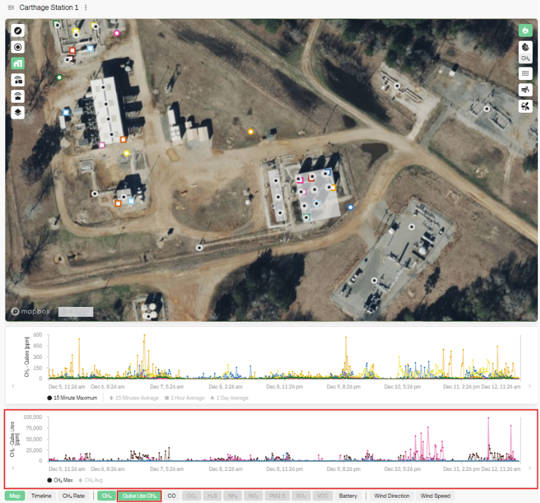
Qube Lite-Specific Concentration Chart
Improvements continue for Qube Lite, our intrinsically-safe, near-source monitoring device.
Track emissions detected by Qube Lite with the newly added Qube Lite CH₄ graph.
Distinguish emissions at the source level without data getting ‘muted’ by site-level methane detection.
Try It Out Today!
If you’ve got any questions about these features or any Qube products, connect with our specialists at Qube Technologies.
For more insights into how Qube Technologies is driving emissions reduction, explore our expert insights, white papers, case studies or reach out directly.