Fewer Site Visits, Faster Repairs: Results from Qube’s EPA-Approved Periodic Screening
Overview
In March 2025, the U.S. EPA approved Qube’s continuous monitoring platform as an Alternative Test Method for periodic screening under NSPS OOOOb and EG OOOOc, with applicability under NSPS OOOOa. The method uses operator-declared 7-day screening windows, a 7-day block average for pass/fail, and 90% probability of detection (PoD) thresholds of 5, 10, or 15 kg/h.
With Qube, operators can satisfy LDAR requirements with fewer scheduled site visits while maintaining an auditable record in the dashboard.
How Periodic Screening Works (EPA Method, Implemented by Qube)
Choose a work practice: Select a 90% PoD threshold (5, 10, or 15 kg/h) appropriate for the site.
Declare a window: Choose a 7-day screening window in the month of the required screen (operator’s choice). Only data inside the declared window counts for LDAR.
Run continuously: Qube’s monitoring operates 24/7.
Compute the result: Qube calculates the 7-day block average during the screening window and returns a pass or fail result.
Compare to the threshold:
a. If pass: Log the result, retain the automated report, and plan the next month’s window.
b. If fail: Perform OGI follow‑up, repair, and document closure in Qube’s inspection report template.
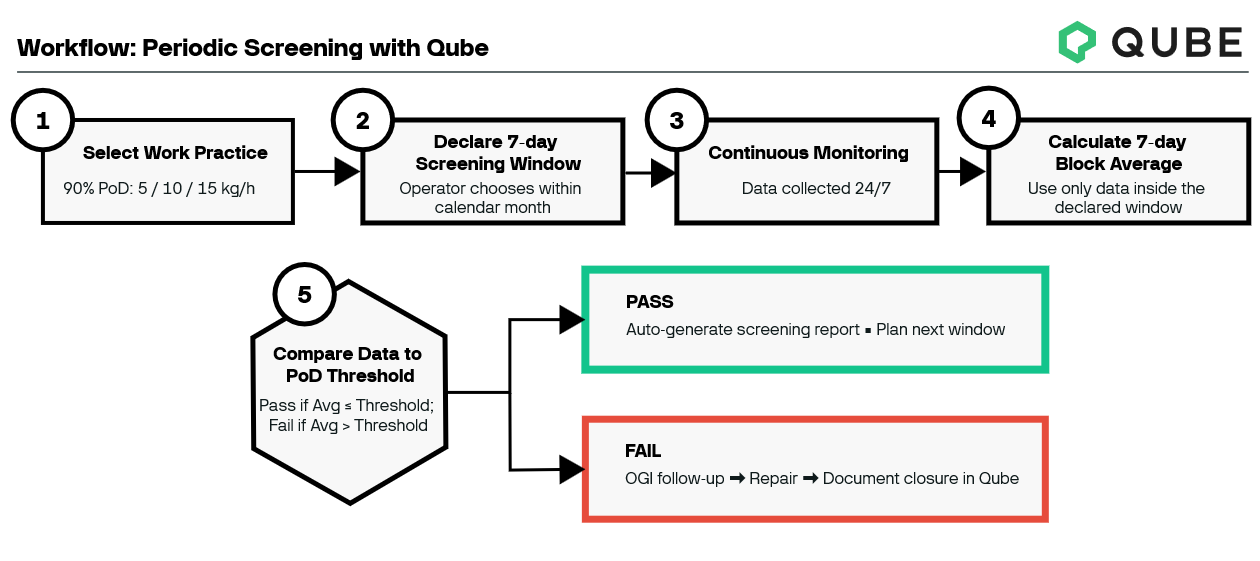
Figure 1. Periodic screening workflow using Qube’s EPA-approved continuous monitoring (90% PoD, 7-day block average).
Choosing the Work Practice
Choosing the criterial for periodic screening will depend on the site itself and, specifically, the respective equipment and operations. There is no one-size-fits-all workflow so the table below outlines the criteria for 5/10/15 kg/h work practices. Where possible, we recommend using the largest sensitivity threshold to implement the most permissive periodic screening program.
Table 1. Periodic screening work practice criteria.

Note: Under EPA’s equivalency approach, pass/fail is determined by the 7‑day block average relative to the selected threshold. Only screens that fail require OGI follow‑up. Providers may recommend the 15 kg/h work practice where practical to minimize unnecessary follow‑ups while maintaining strong compliance.
Case Study: Periodic Screening at a Central Processing Facility
This case study applies the 5 kg/h work practice at a central processing facility, explains why January failed and triggered OGI, and shows how February passed without a follow-up. The result is a clear, auditable path to compliance with fewer scheduled site visits.
For operators, this demonstrates how Qube’s continuous monitoring can save time on OGI inspections and scale across assets. The operator selected a 90% PoD at 5 kg/h, requiring 12 screening periods per year (one per month) at its central processing facility (Fig. 2). For the first two screening periods of 2025—January and February—the operator used Qube’s platform to define the 7-day windows and evaluate site-level emissions under EPA’s framework.

Figure 2. Qube’s continuous monitoring deployed at a central processing facility. Work practice: 5kg/h with12 screenings. Defined periodic screenings: Jan 16-22, 2025, and February 18-24, 2025.
Screening Period #1
During the first window, Qube’s dashboard showed that the 7-day block average emission rate exceeded the 5 kg/h threshold. The system returned a fail, prompting a required OGI follow-up. The operator completed the inspection, located the source, made repairs, and documented the event in Qube’s compliance system.

Figure 3. Time-series for Screening Period #1 (January 16–22, 2025). The red line indicates the 5 kg/h PoD threshold. The 7-day block average (black line) exceeded the threshold, triggering a fail result and requiring OGI follow-up.
Some operators already use their own tools to track OGI findings; Qube provides built-in software to track OGI inspections and drive findings through closure (Fig. 4).

Figure 4. Qube’s inspection report template captures survey descriptions including survey type, date, location, source, and description.
Screening Period #2
In the second screening window, the average emission rate remained below the 5 kg/h threshold. The screen passed, and no additional action was required. The operator proceeded with planning the next screening period for March.

Figure 5. Time-series for Screening Period #2 (February 18–24, 2025). The average emission rate remained below the 5 kg/h; no OGI follow-up was required.
Conclusion: Benefits for Oil and Gas Operators
Lower Emissions
Continuous monitoring alerts operators when emission events occur and captures intermittent emissions that may be missed during a scheduled inspection.
Simplified Compliance
Qube’s continuous monitoring platform is recognized by the EPA as an equivalent alternative to quarterly OGI inspections. This enables operators to meet requirements under Subparts OOOOa, OOOOb, and OOOOc with fewer site visits and more flexible scheduling. For example, a 15 kg/h PoD threshold allows for 12 automated screening periods annually with only one mandatory OGI inspection.
Reduced Operational Burden
With Qube, operators avoid coordinating and scaling labor-intensive field inspections across large portfolios. Screening periods are declared at the operator’s discretion, and follow-up is required only when thresholds are exceeded.
Lower Costs
In traditional LDAR programs, inspection frequency drives labor and logistics. Qube’s flat pricing and tailored deployment makes it customizable and highly scalable across sites and regions.
Continuous Operational Insight
Even outside declared windows, continuous monitoring provides data that support:
detection of unexpected or off-cycle emissions;
real-time tracking of repair effectiveness;
predictive maintenance planning; and
facility-uptime analytics.
Operational Flexibility
Operators can tailor thresholds by site, adjust frequency as infrastructure evolves, and align regulatory, voluntary, and ESG-driven strategies within one monitoring framework.
Qube’s EPA approval for periodic screening under OOOOa, OOOOb, and OOOOc represents confidence in Qube’s technology and performance for emissions monitoring. For operators, Qube’s continuous monitoring delivers the tools to stay compliant, scale performance, prioritize leaks, and act on emissions in real time.
FAQs
-
The EPA approved Qube as an Alternative Test Method for periodic screening under OOOOb and OOOOc, with applicability to OOOOa as outlined in the rulemaking. Operators can use Qube in place of, or alongside, quarterly OGI for LDAR compliance.
-
The rules address upstream and midstream assets such as well sites, centralized production facilities, and compressor stations.
-
An operator declares a 7‑day window within the required month. Qube determines pass or fail using the 7‑day block average; only data collected during the declared window counts for LDAR, while data outside the window remains available for diagnostics and repair validation.
-
A “fail” occurs when the 7-day block average exceeds the selected PoD threshold. A “fail” requires an OGI inspection to locate and repair the source, and the action is documented in Qube’s reporting.
-
The EPA’s equivalency band allows 90% PoD thresholds of 5, 10, or 15 kg/h. In the methodology illustrated, 5 kg/h uses 12 screens per year, 10 kg/h uses 6 screens per year, and 15 kg/h uses 12 screens per year with one scheduled OGI.
-
Choosing an emission rate threshold is not a one-size-fits-all solution. For each site, a threshold should reflect the respective operations and equipment. Qube recommends the 15 kg/h PoD method for many facilities because it meets compliance with minimal operational disruption while focusing follow-up on higher impact events. Feel free to contact us if you have specific questions about your assets.
-
Qube generates a detailed screening report for each window and provides an inspection report template that captures survey type, date, location, source, and description for OGI follow-ups.
-
Continuous monitoring cuts scheduled site visits and sends crews only when needed.
Benefits include:
lower personnel time
flat pricing that scales across diverse asset portfolios.
-
It can satisfy periodic screening requirements and reduce routine OGI, but OGI remains the follow-up method when a screening period fails and may still be required annually, depending on the chosen work practice.
-
At a central processing facility using the 5 kg/h periodic screening method, January’s screen failed and drove an OGI repair, while February’s screen passed with no follow-up actions. Both outcomes are captured in the Qube platform reports.
Reach out today to learn more about Qube Technologies’ continuous monitoring solution and talk to one of our specialists today.
Interested in more operational examples how Qube Technologies is driving emissions reduction and sustainability in the oil and gas sector? Explore our other resources and case studies or reach out directly.