Qube’s Emissions Detection, Localization and Quantification Results from METEC ADED 2025
TL;DR
METEC ADED 2025 tested Qube’s continuous monitoring under dense, overlapping, mostly low-rate methane emissions from 11+ simultaneous sources.
Qube localized emissions to the correct equipment group 96.7% of the time, improving field crew efficiency.
Emission rates were accurately quantified within 1 sigma across varied release scenarios, including releases from heights (e.g., storage tanks).
Detection probability exceeded 90% within 15 minutes for >5 kg/h releases; within ~1 hour for smaller events.
Overview
Qube Technologies is proud to share our results from METEC ADED 2025.
Check out the raw results yourself with these time series plots of emission rates throughout the 13-week controlled release program. Step through the test period with the forward and back buttons to see how well emission rate events coincide between the Ground Truth Release data and Qube’s Predicted Emission Rates determined using a standard fenceline deployment and production emissions model running in real-time.


View the official ADED 2025 Report from METEC below:
Unpacking the Results
Emission Testing Scenario
METEC tested complex emission scenarios in 2025, regularly emitting from 11 or more sources. It’s important to note that these sources were often emitting at different rates simultaneously. Many of the emissions tested were in the form of low persistent releases meant to simulate “combustion slip” of 0.125kg/hr or less, all releasing simultaneously across the ten sources on groups 5S and 4S. Additional larger rate releases were conducted concurrently as well from other sources and groups.
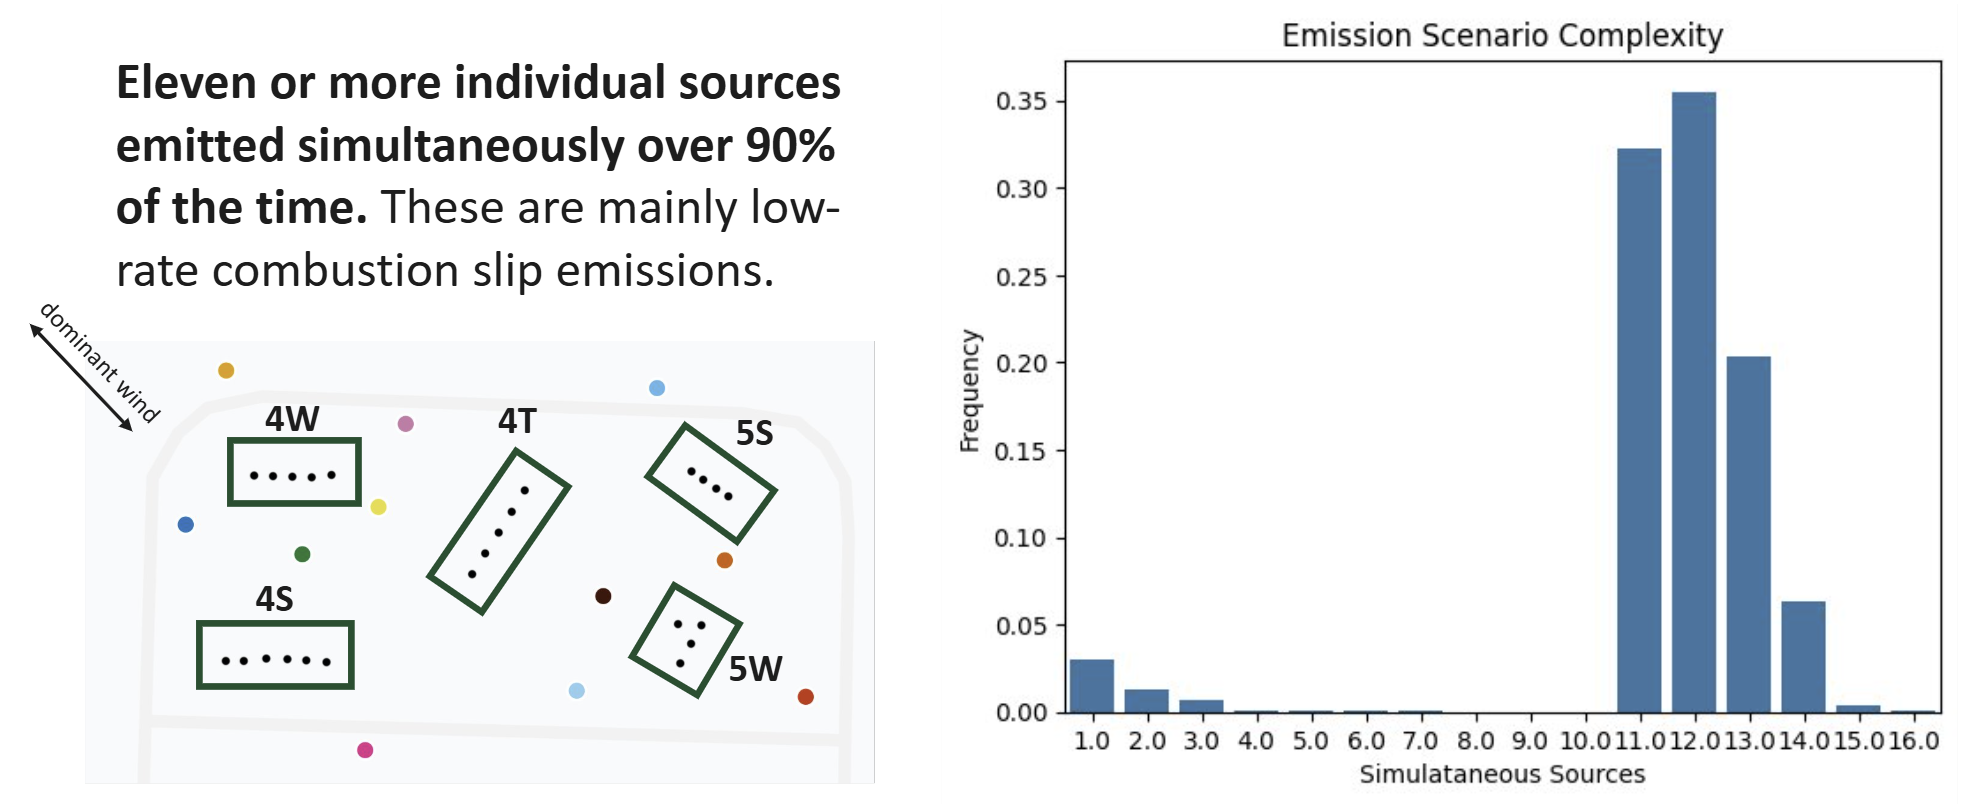
Figure 1 - The distribution of simultaneous emissions from sources at METEC during ADED 2025. Source groups are indicated and labelled in the subplot on the left. Device locations are indicated with coloured points. The subplot on the right shows the distribution of simultaneous emissions at the group level after discretizing temporally into 15 minute buckets.
Localization
Despite the challenging testing scenario, Qube’s solution managed to accurately detect, localize, and quantify emissions to the equipment group level 96.7% of the time. High localization accuracy means crews can spend less time in the field finding and resolving leaks.
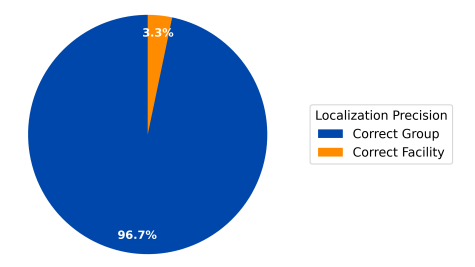
Figure 2 - Localization Precision chart from the official METEC Report (page 14).
Emission Rates
High accuracy localization is also important for correctly modeling and quantifying emission rates. Across the spectrum of varied release rates and release scenarios, including releases from heights, Qube’s solution was able to correctly quantify emission rates to within 1 sigma.

Figure 3 - Predicted mean emission rates +/- 1 sigma corresponding to source group ground truth emission rates aggregated to 1kg/h intervals.
Detection
Qube’s ability to detect an emission within a 15-minute time period is shown below as a function of release rate. For emission rates beyond 5 kg/h, detection within 15-minutes occurred more than 90% of the time. For rates below 5 kg/h, detection probability would reach >90% within ~1 hour.
To understand how Probability of Detection (PoD) increases with time click here for a blog post where we explore the relationship between PoD and Time-to-Detection for continuous monitoring systems. For more information on Qube’s PoD, click here for a report by Highwood Emissions Management.

Figure 4 - Fraction of 15-minute periods that are true positive or false negative predictions vs the source group ground truth emission rates aggregated to 1kg/h intervals.
Quantification
Qube’s fenceline continuous monitoring solution performed exceptionally well at quantification when source group rates exceeded 2.0 kg/h. The ADED 2025 emission distribution was heavily weighted towards small emission rates with a majority of emission volumes released at rates less than 2.0 kg/h which led to an underestimation at those rates. For group-level rates > 2 kg/h, or individual source rates > 1 kg/h, quantification accuracy was much higher.
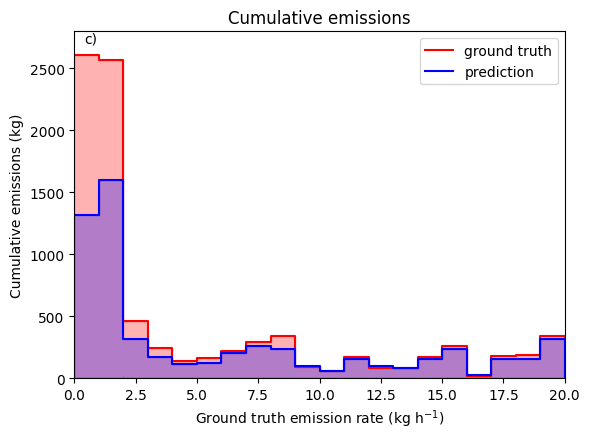
Figure 5 - Cumulative ground truth and predicted emission mass occurring through the experiment. Totals have been aggregated into 1 kg/h increments based on the ground truth release rate.
Including the significant volumes released at source rates < 1 kg/h, the Qube solution had an overall underestimation of 29.7% over the 13-week testing period. When isolating only individual source rates above 1 kg/h, overall quantification accuracy over the 13-week period is closer to 1%.
Conclusion
ADED 2025 pushed continuous monitoring systems with dense, overlapping releases and a heavy skew toward low-rate emissions. Qube’s fenceline deployment handled this complexity with high localization accuracy, strong detection performance, and reliable quantification at operationally relevant rates. These results confirm that our real-time, physics-based approach can track challenging emission scenarios with consistency.
Thanks to the METEC team for running a rigorous testing program. Their controlled release framework remains a critical benchmark for evaluating continuous monitoring technologies, and we appreciate their support in facilitating these third party testing opportunities.
FAQs
-
METEC refers to a testing protocol used to analyze emissions from multiple sources. In 2025, it conducted complex emission scenarios, regularly emitting from 11 or more sources simultaneously. The protocol includes detailed methodologies for detecting and quantifying emissions, ensuring accurate performance metrics during testing. METEC aims to enhance the credibility and effectiveness of emission monitoring technologies.
-
METEC uses a set of rigorous and evolving methodologies for testing emission detection and quantification technologies. Here are the key methodologies employed:
Controlled Release Experiments
METEC conducts controlled emission releases at its test facility, simulating real-world scenarios with varying emission rates, durations, and source locations.
In recent protocols (e.g., ADED 2025), tests involve complex scenarios with simultaneous emissions from 11 or more sources, including both low persistent and higher-rate releases.
Discretized Time Intervals
The latest protocol discretizes time into intervals, treating each interval equally. This allows for:
Capturing the continuity and variability of emissions.
Simpler, distance-based matching between predicted and actual emissions.
Direct comparison of predicted and ground truth emission rates and volumes within each interval.
Emission Event Matching Algorithm
Emission events are defined by start time, end time, source, and emission rate.
A matching algorithm pairs ground truth emission events with predicted events based on:
Equipment unit
Equipment group
Facility level
True positives, false positives, and false negatives are determined by this hierarchical matching.
Separation of Detection and Alarming
METEC distinguishes between a technology’s ability to detect changes in methane (CH₄) and its ability to trigger alarms or recommend actions.
Metrics are tracked separately for detection sensitivity and alarm performance.
Multi-Level Performance Metrics
Performance is evaluated at multiple levels:
Source level
Source group level
Full facility level
This allows for detailed analysis of detection, localization, and quantification accuracy.
Technology-Agnostic Testing
Both supervised (e.g., aerial surveys, satellite flyovers, OGI surveys) and autonomous (continuous monitoring) solutions are tested.
Protocols are designed to compare solutions with different spatial and temporal sampling strategies.
Handling of False Positives and Emission Splitting
The protocol accounts for emission splitting (when a single real emission is detected as multiple events) and evaluates the impact on false positive rates.
Cumulative volume released over time is also considered for alarming and performance assessment.
-
You can access the full METEC Testing Protocol here.