Qube Platform Release 2.57: Improvements to Emission Timelines, Event Log and Alarm Notifications
With Release 2.57, you get better emission threshold visibility, event tracking, and alarm clarity.
Want to see how it works?
Industry-Specific Thresholds on the Emission Timeline
Emission Timeline colors now have a legend and thresholds representative of respective site type.
The threshold site types are:
Oil and Gas (lowest threshold)
Agriculture (moderate threshold)
Landfill (highest threshold)
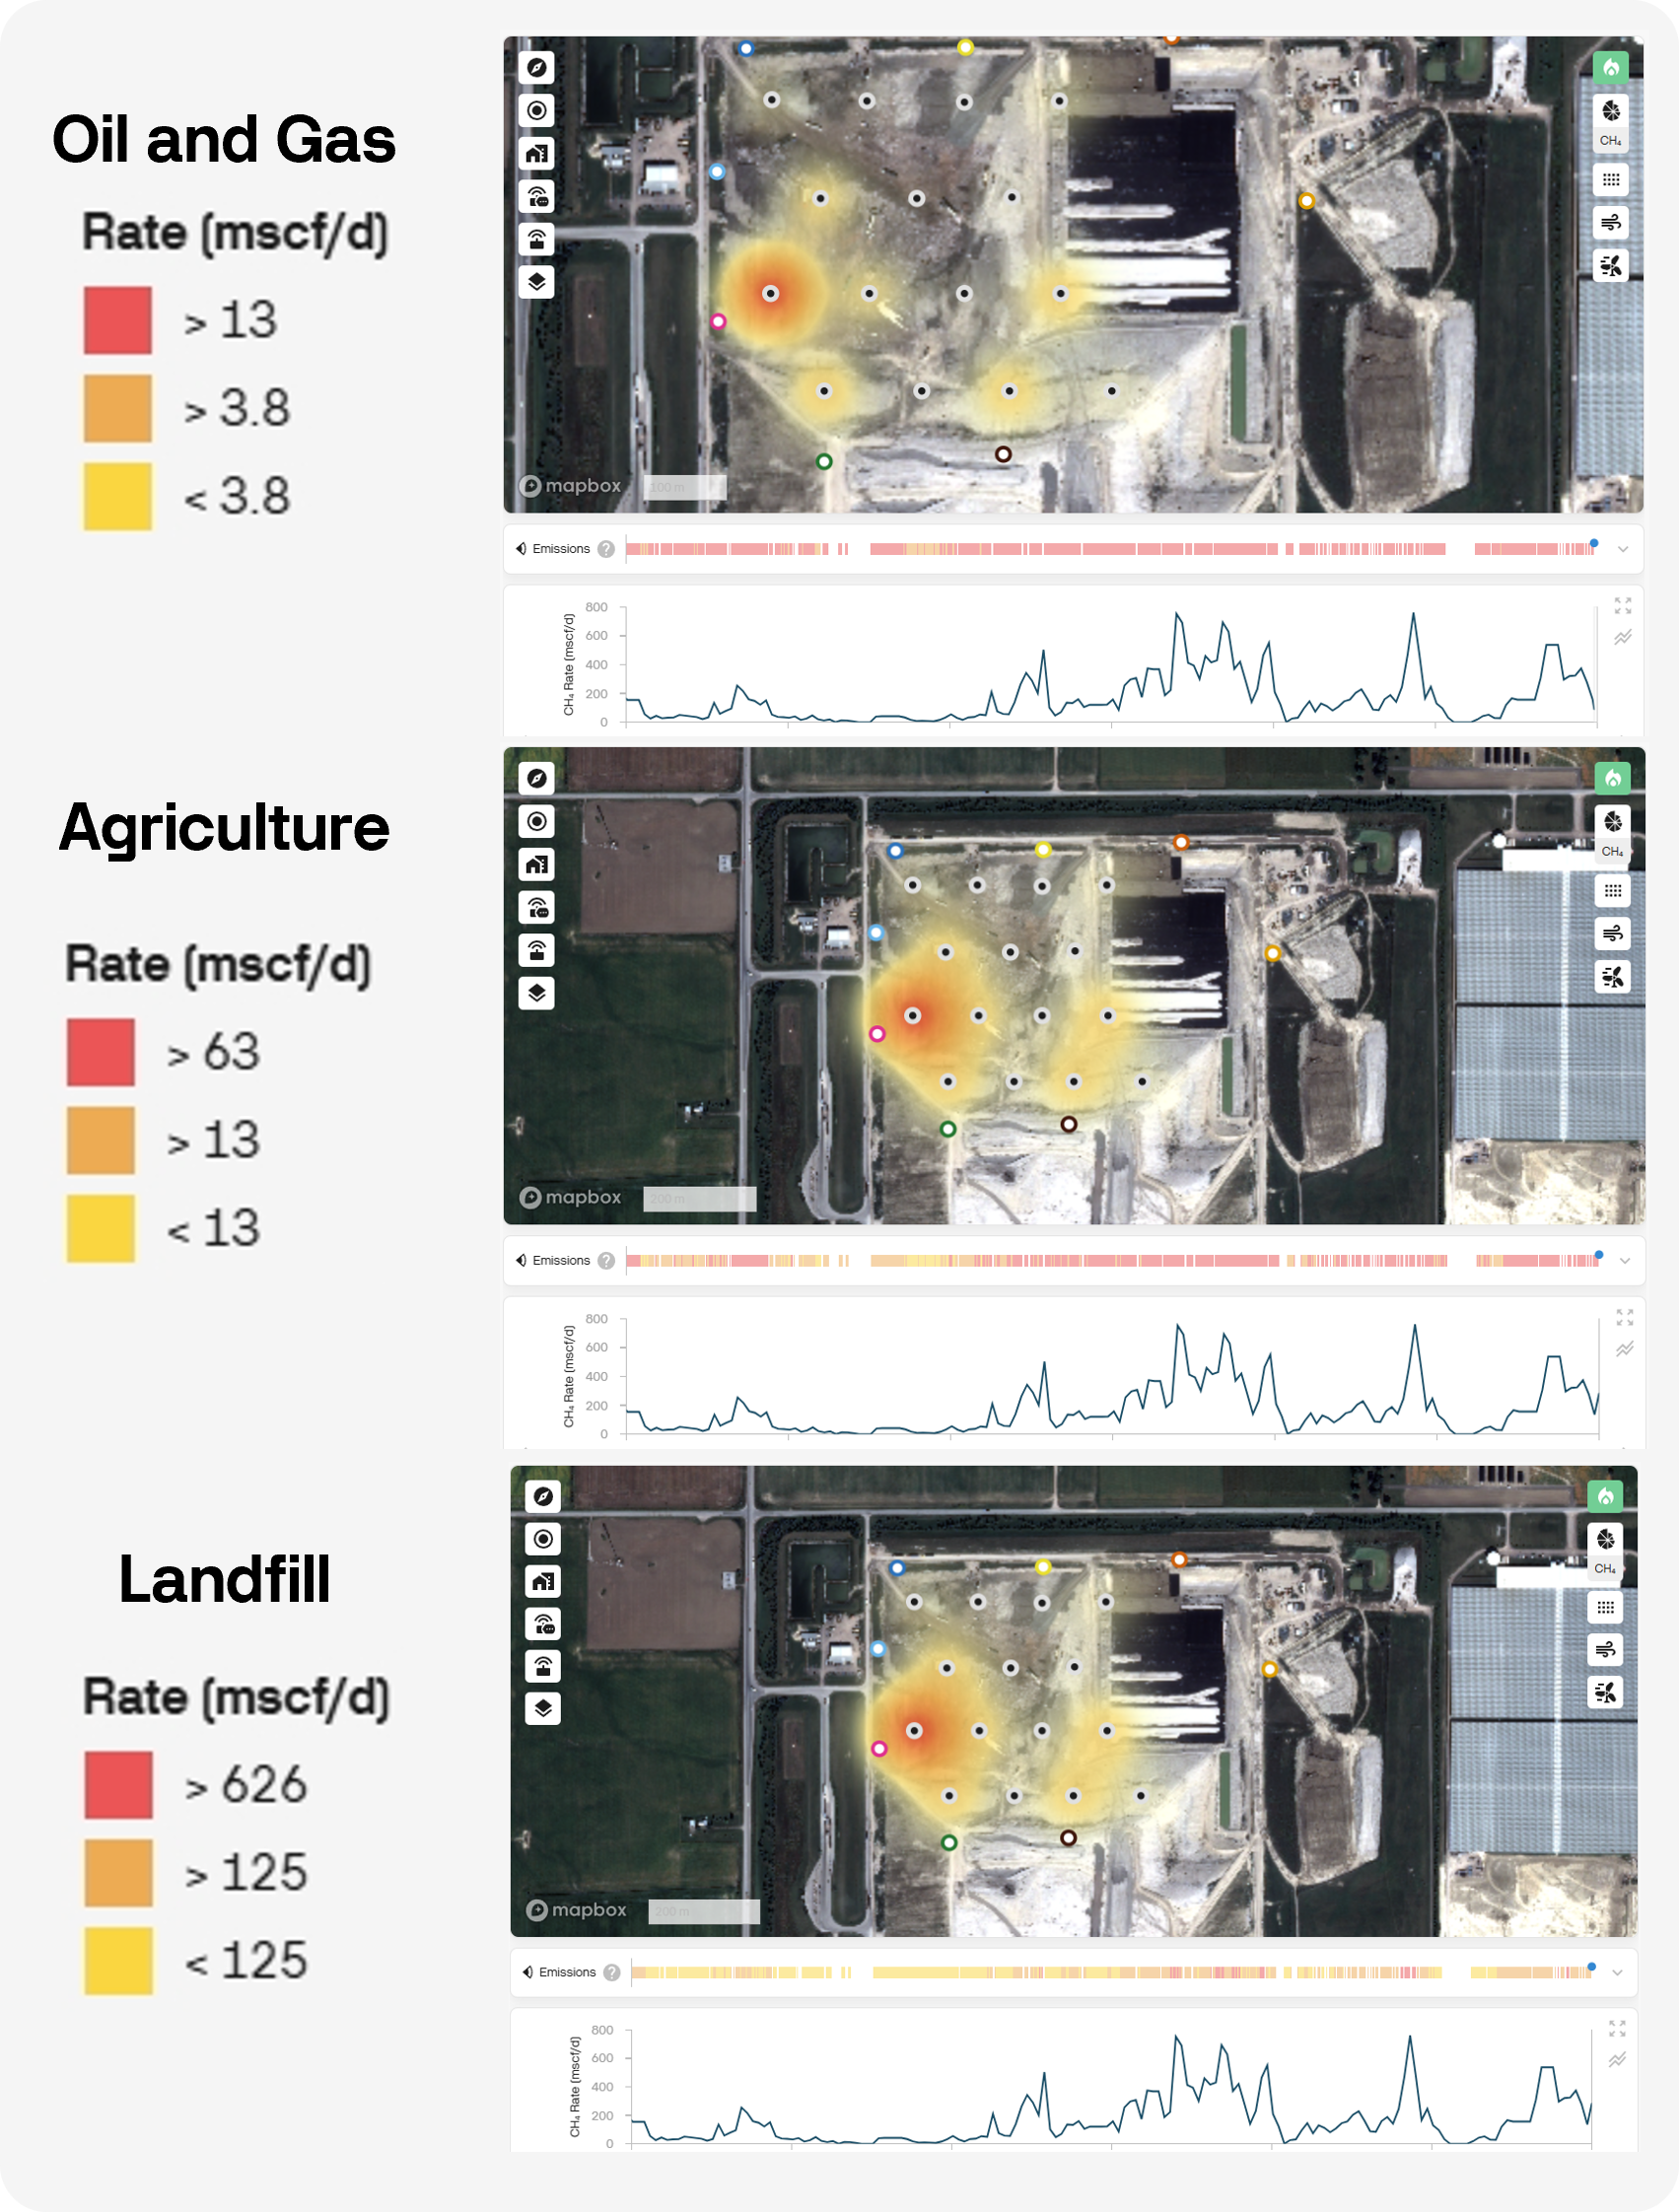
Release 2.57 introduces industry-specific thresholds on the Emissions Timeline.
Event Log Page and Shortcut
The Alarms page is now the Event Log page.
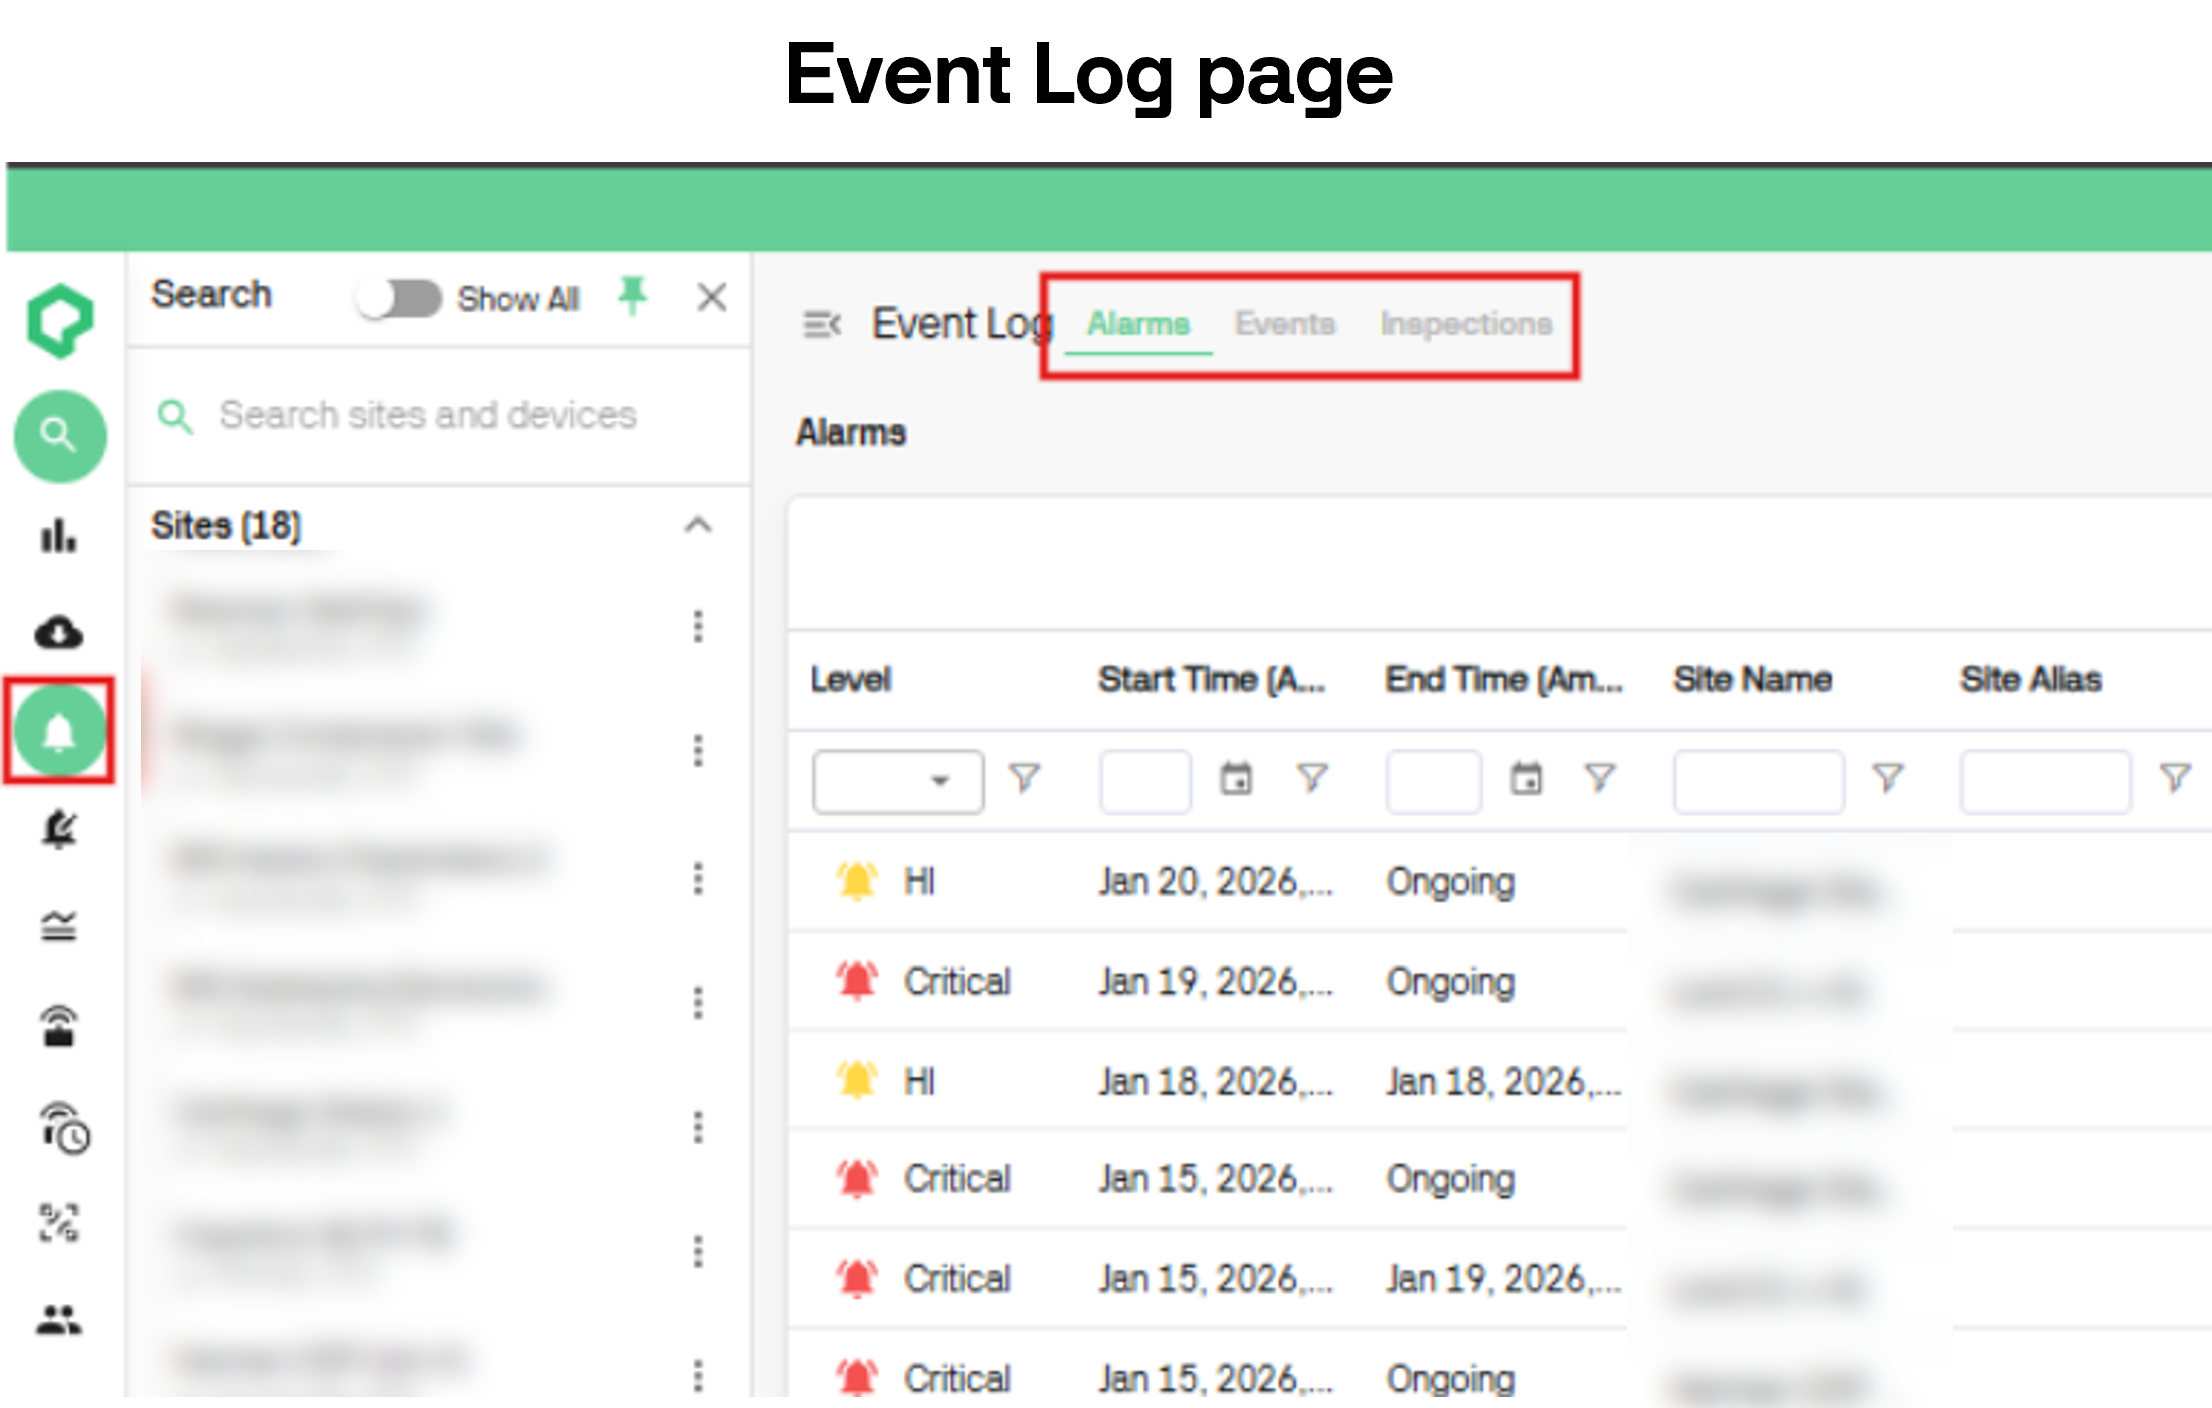
The Alarms page is now the Event Log page and contains tabs for Alarms, Events, and Inspections.
Get to the page by clicking on the alarm bell icon on the left side of the dashboard.
Alternatively, you can access via the Overview and Site Dashboard. A ‘See More’ button has been added under each list of alarms, events, and inspections. Clicking this will take you to the corresponding tab in the Event Log page.
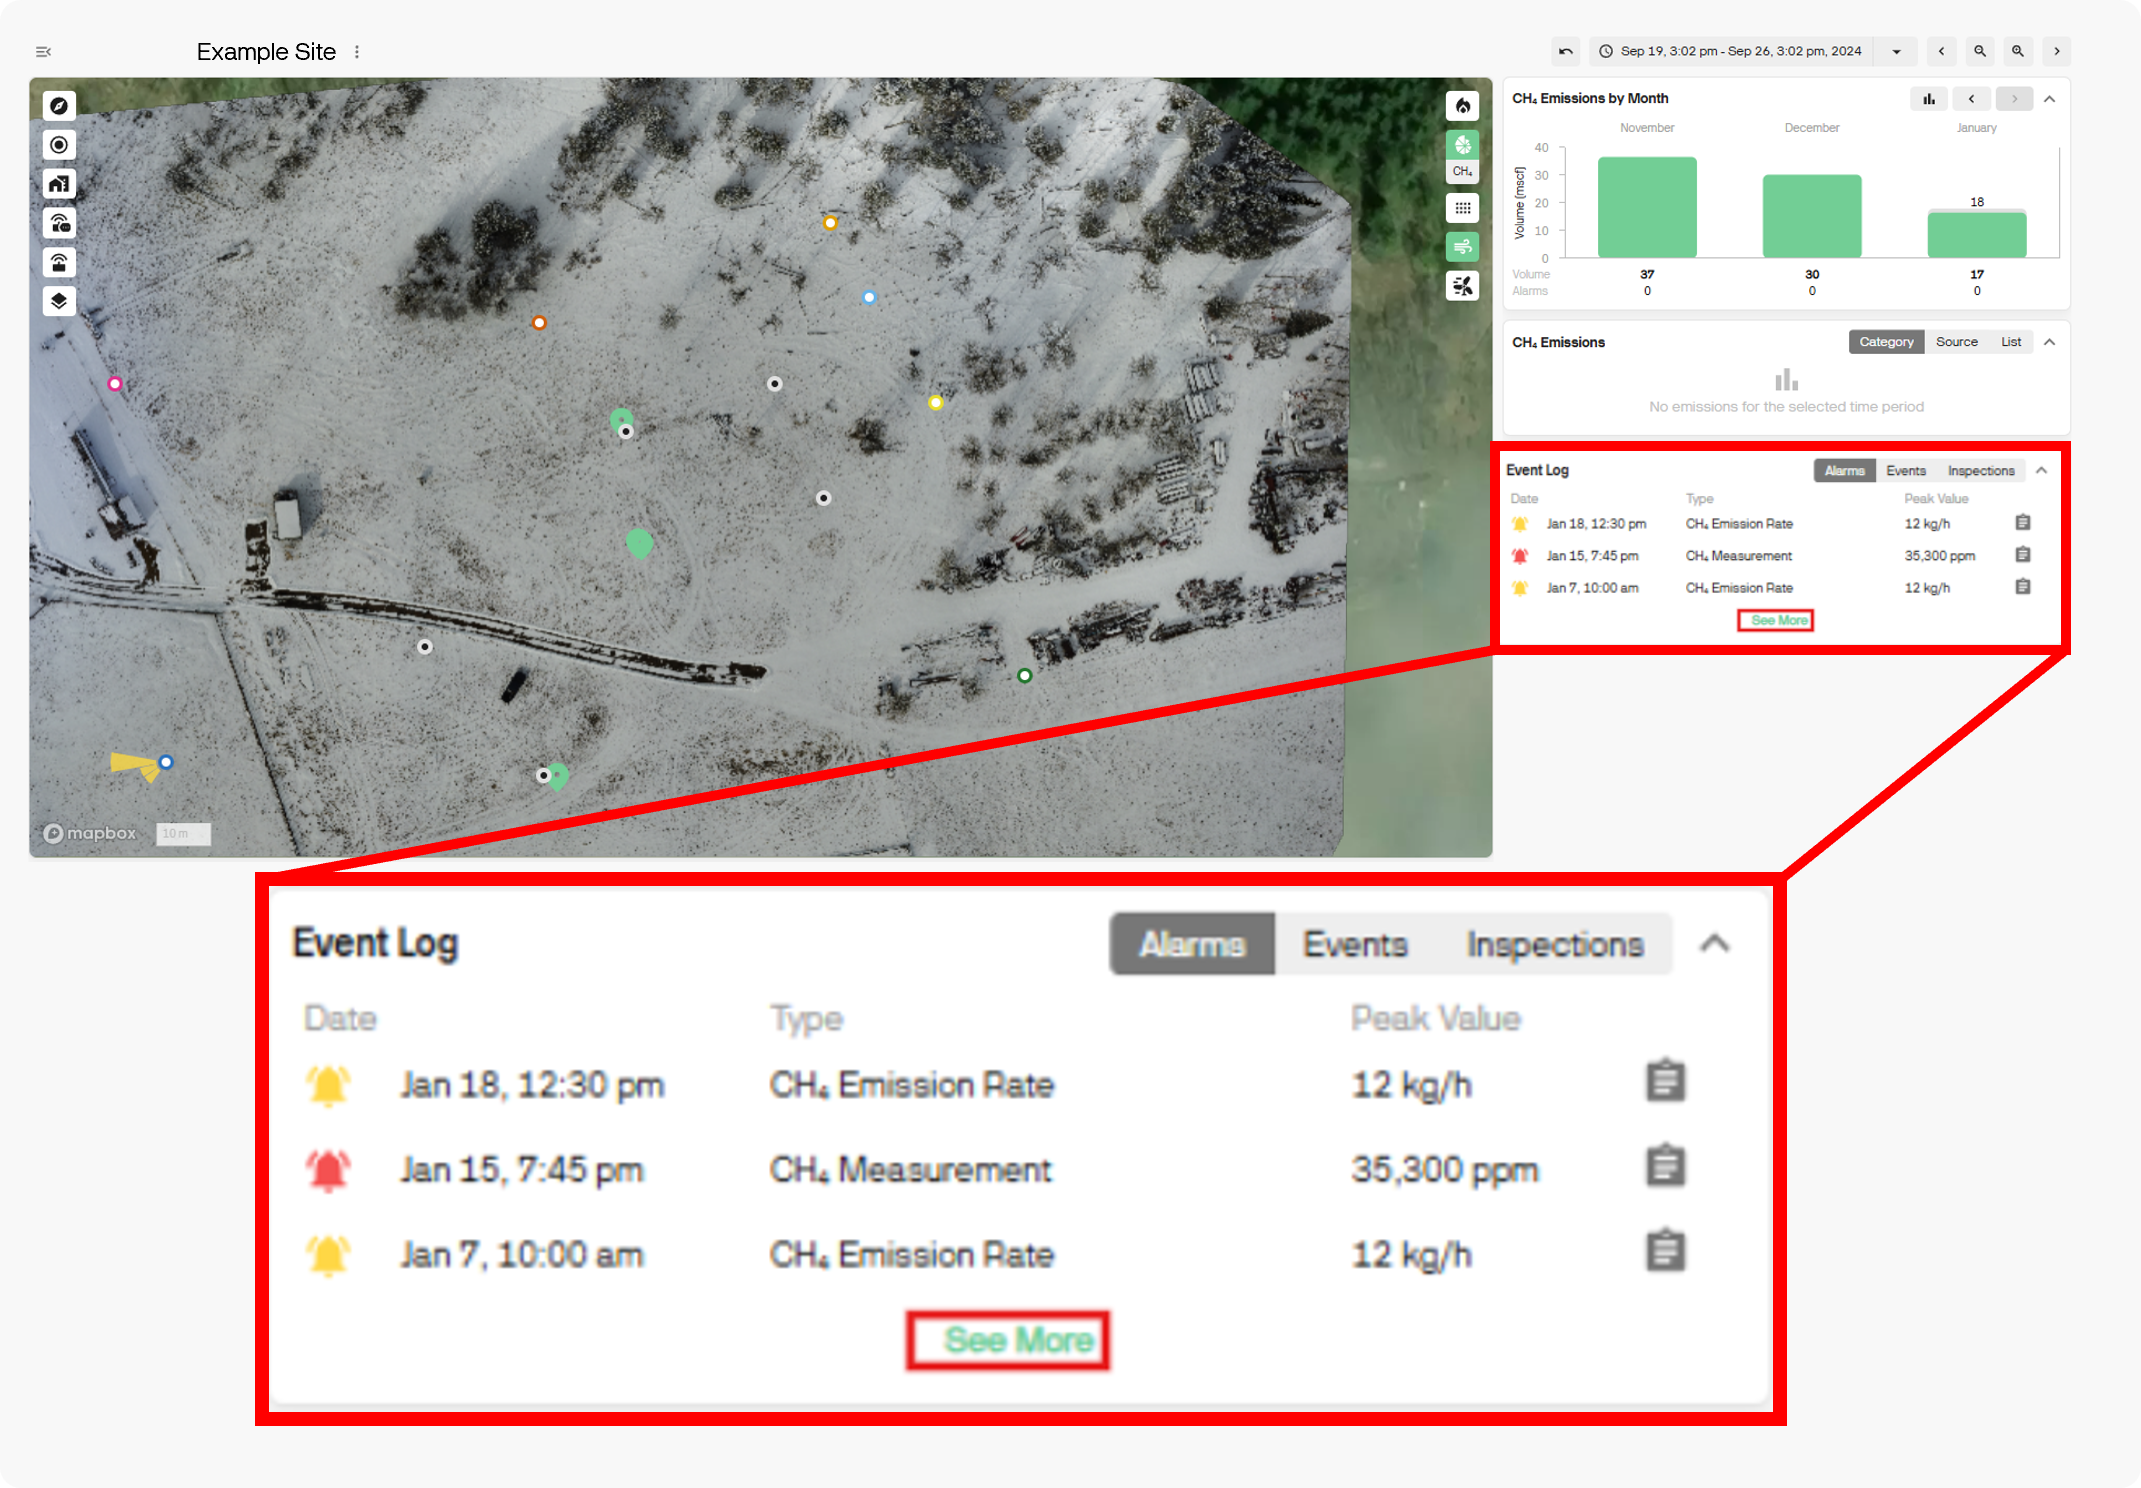
Access the Event Log via the Overview or Site Dashboard pages.
Alarm Email Clean Up
Improved clarity in the Alarm email.
Only the main contributing sources are listed in the email with others listed as additional sources. More information can be found in the dashboard.
This cleans up the message and focuses on the largest emission sources.
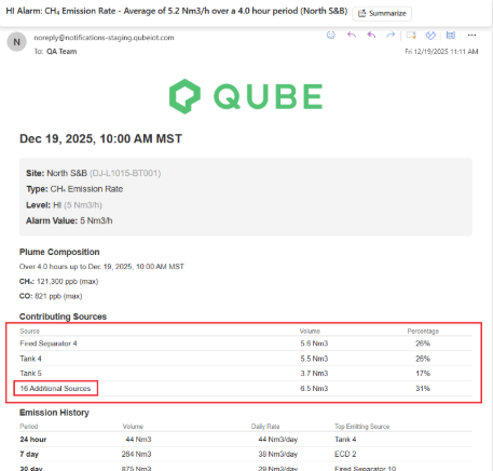
The contributing sources listed in the alarm email now includes only the top three sources.
Try It Out Today!
If you’ve got any questions about these features or any Qube products, connect with our specialists at Qube Technologies.
For more insights into how Qube Technologies is driving emissions reduction, explore our expert insights, white papers, case studies or reach out directly.