Emission Detection from Heights: Improvements to Qube’s Plume Modeling
How Qube’s new source geometry modeling improves emission rate estimates for elevated sources
TL;DR
Elevated methane releases can be detected at Qube’s ground-based continuous monitoring sensors.
Point-source assumptions can underrepresent near-source turbulence and plume spread.
Representing leaks as finite 3D sources improves agreement with measured concentrations.
METEC releases from storage tank tops showed high accuracy and low bias for Qube’s rate estimates.
Time-series results from METEC showed Qube captured essentially every controlled tank release interval.
A common question we get is whether methane released from elevated equipment, such as storage tanks, “floats away” and avoids detection from ground-based sensors. In practice, wind-driven mixing, turbulence, and structure-driven flow often bring portions of the plume back toward sensor height. The harder problem is not whether a plume can be detected, but whether a simplified dispersion model can reproduce what a real plume looks like after interacting with equipment and structures. This post explains a modeling upgrades made by Qube Technologies that improves elevated-source performance over previous point source modeling.
Why elevated releases can still be measurable at the fenceline
Methane is buoyant relative to air, but buoyancy is only one factor in the transport problem. On operating sites, near-field plume behavior is strongly shaped by:
Mechanical turbulence created by wind shear and surface roughness
Wake and recirculation around large equipment
Downwash where flow rolls over and around tanks and related structures
For tank-top releases, downwash can pull methane down the tank sides and spread it laterally, producing concentration patterns that differ from an idealized plume released into unobstructed flow.
The modeling constraint: better near-field physics
High-fidelity CFD can represent spatially varying winds and obstacle effects, but it requires detailed geometry, meshing, boundary conditions, and is computationally expensive. By contrast, Gaussian dispersion methods are lightweight and practical for continuous monitoring workflows, but they often assume simplified wind fields and limited structure effects. Controlled-release comparisons at METEC show that Gaussian approaches can align with CFD in some conditions, but can deviate near obstructions where winds become spatially complex.
The practical question becomes: what model change yields the most benefit when detailed leak mechanics are unknown?
Improved source geometry: replacing a point source with a finite 3D source
Historically, many dispersion implementations treat a leak as a point source, meaning emissions originate from a single coordinate with no initial size. That assumption can be adequate for some sources, but it can underrepresent early plume growth when the real release interacts with surfaces, edges, and wakes.
A useful approximation is to represent certain sources as finite 3D shapes (e.g., spheres or cylinders) and treat emissions as originating from the surface of that shape. Conceptually, this introduces an effective initial plume size, which:
increases near-source spread (a proxy for unresolved turbulence), and
produces downwind concentration fields that more closely resemble measured behavior at sensor height.
It provides a targeted correction to the source representation that improves model fidelity in the use case. In other words, what the plume looks like by the time it reaches the sensor network.
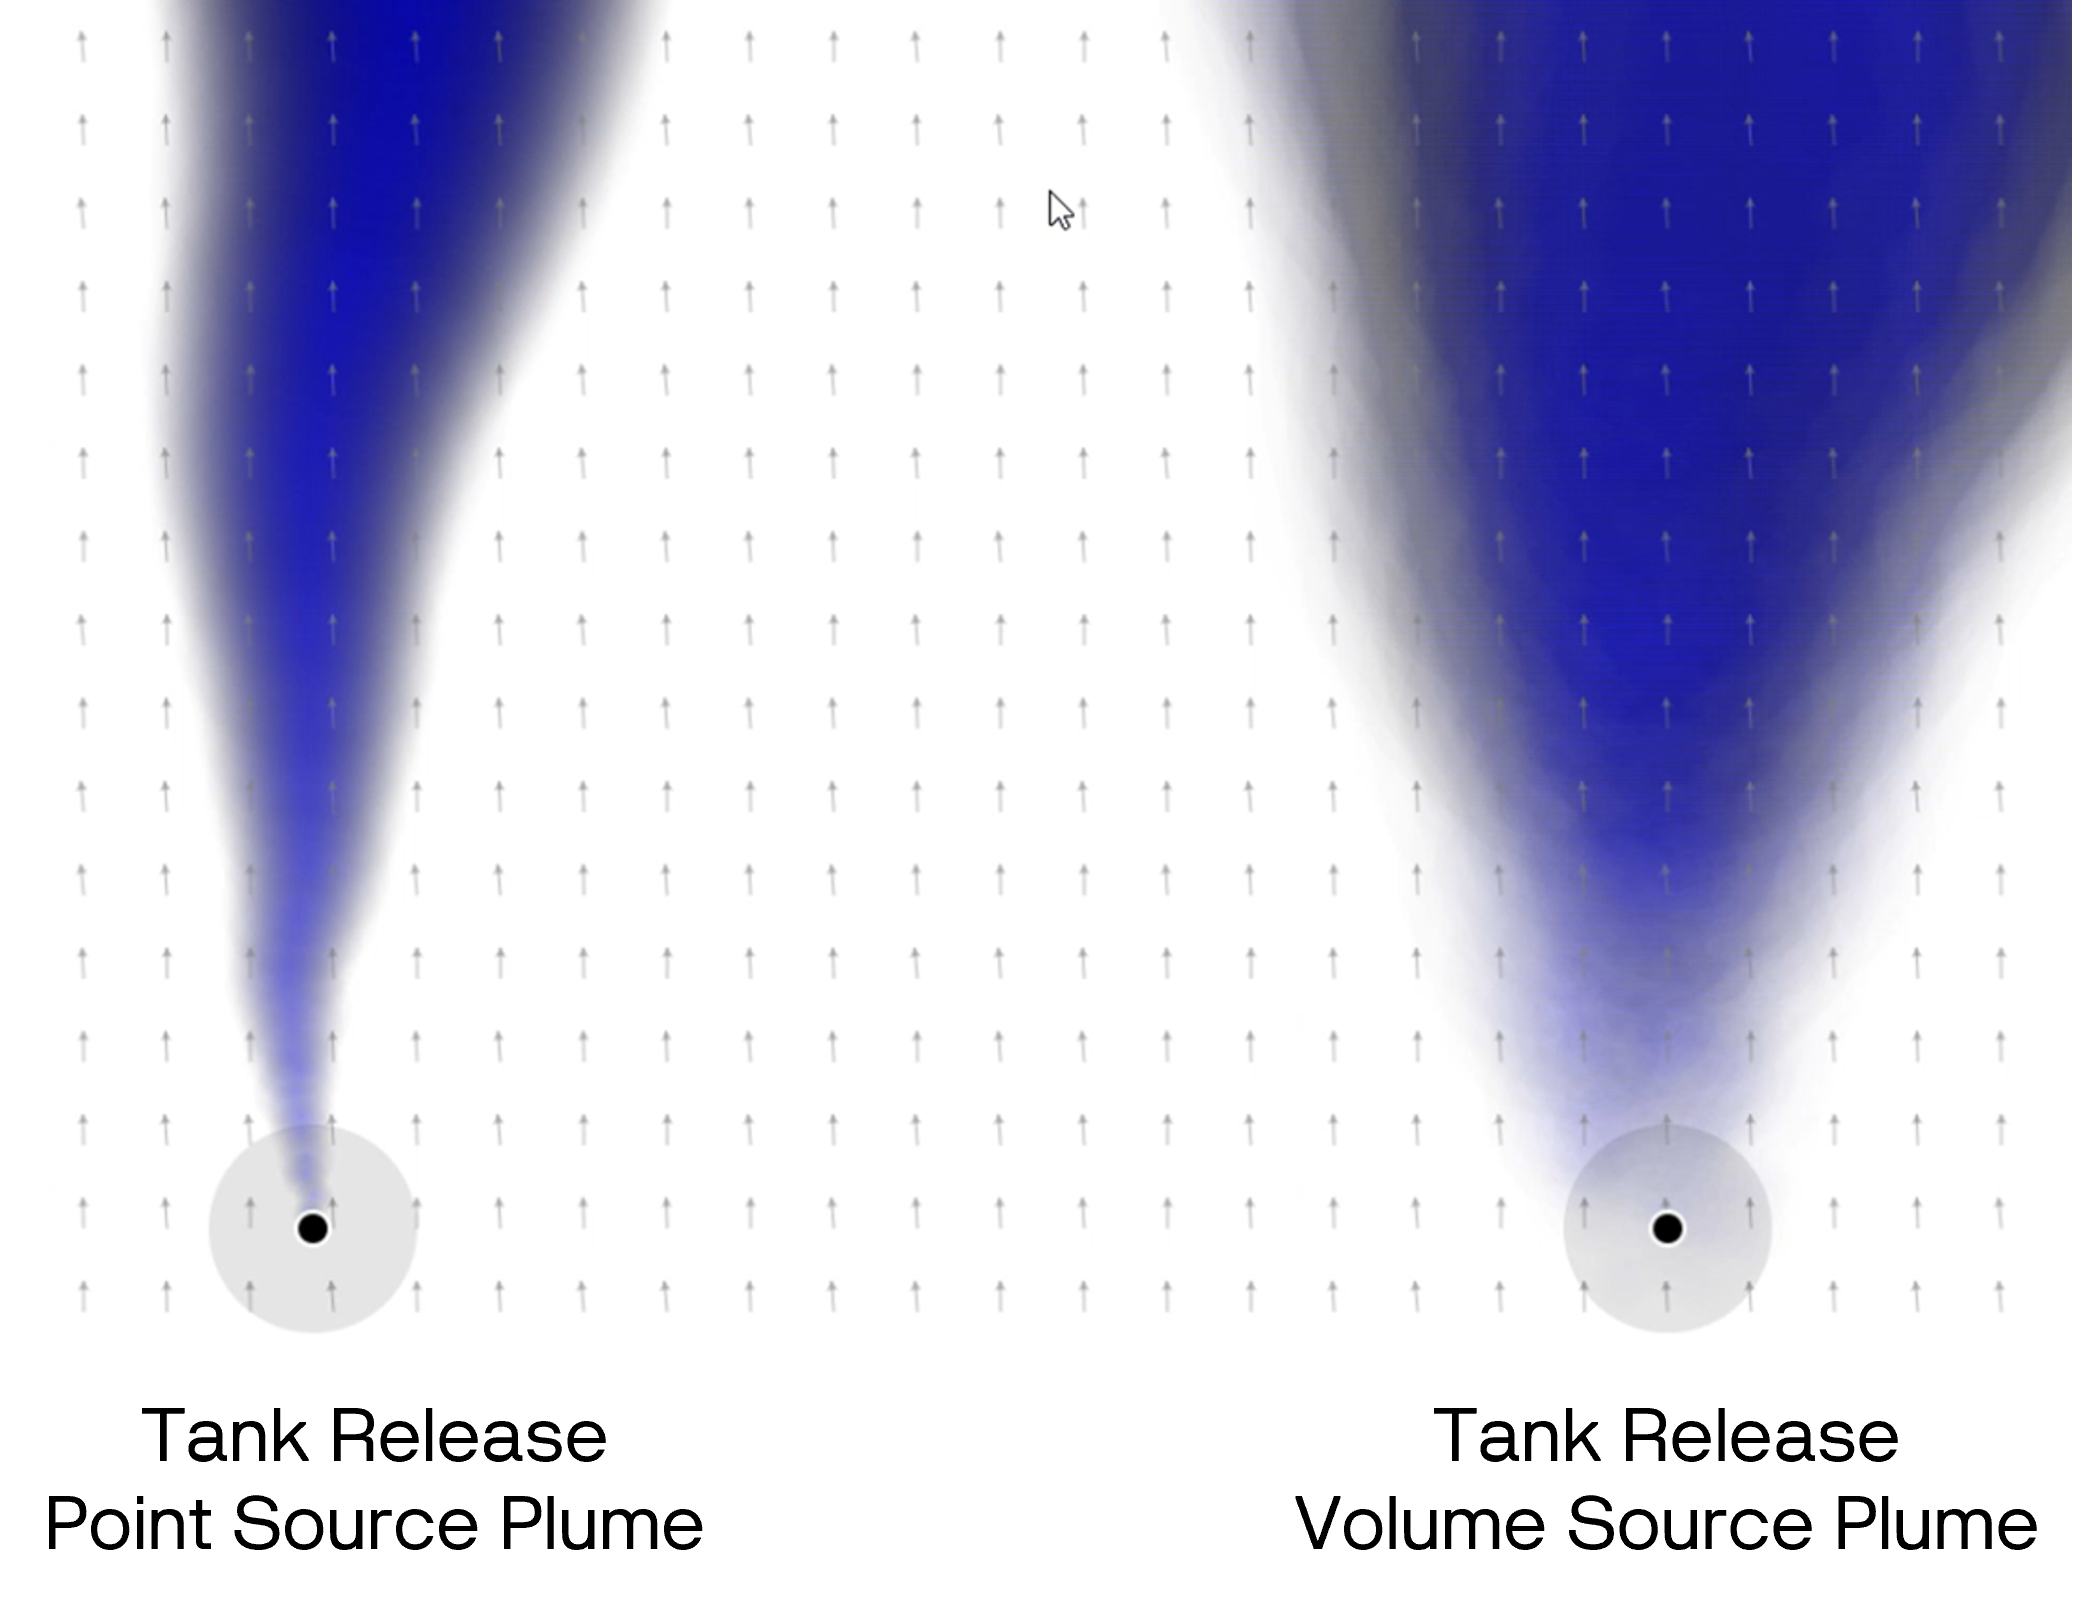
Figure 1. Modeling tank emissions. A point source plume simulation is compared to the newer volume source plume simulation. Note the discrete pattern of the point source while the larger diffuse plume of the volume source plume, enabling it to increase accuracy.
Why obstacles matter for simplified dispersion
Work by Fish et al. (2025) compared Gaussian dispersion approaches with CFD at the METEC controlled-release site (Fig. 2). Their results highlight a practical boundary: Gaussian approaches can compare favorably far from obstructions, but may perform worse near obstructions where wind fields become spatially heterogeneous.
That finding aligns with the motivation for a source-geometry correction: if you cannot solve the full flow field, you can still reduce error by improving how the release is represented at the source.
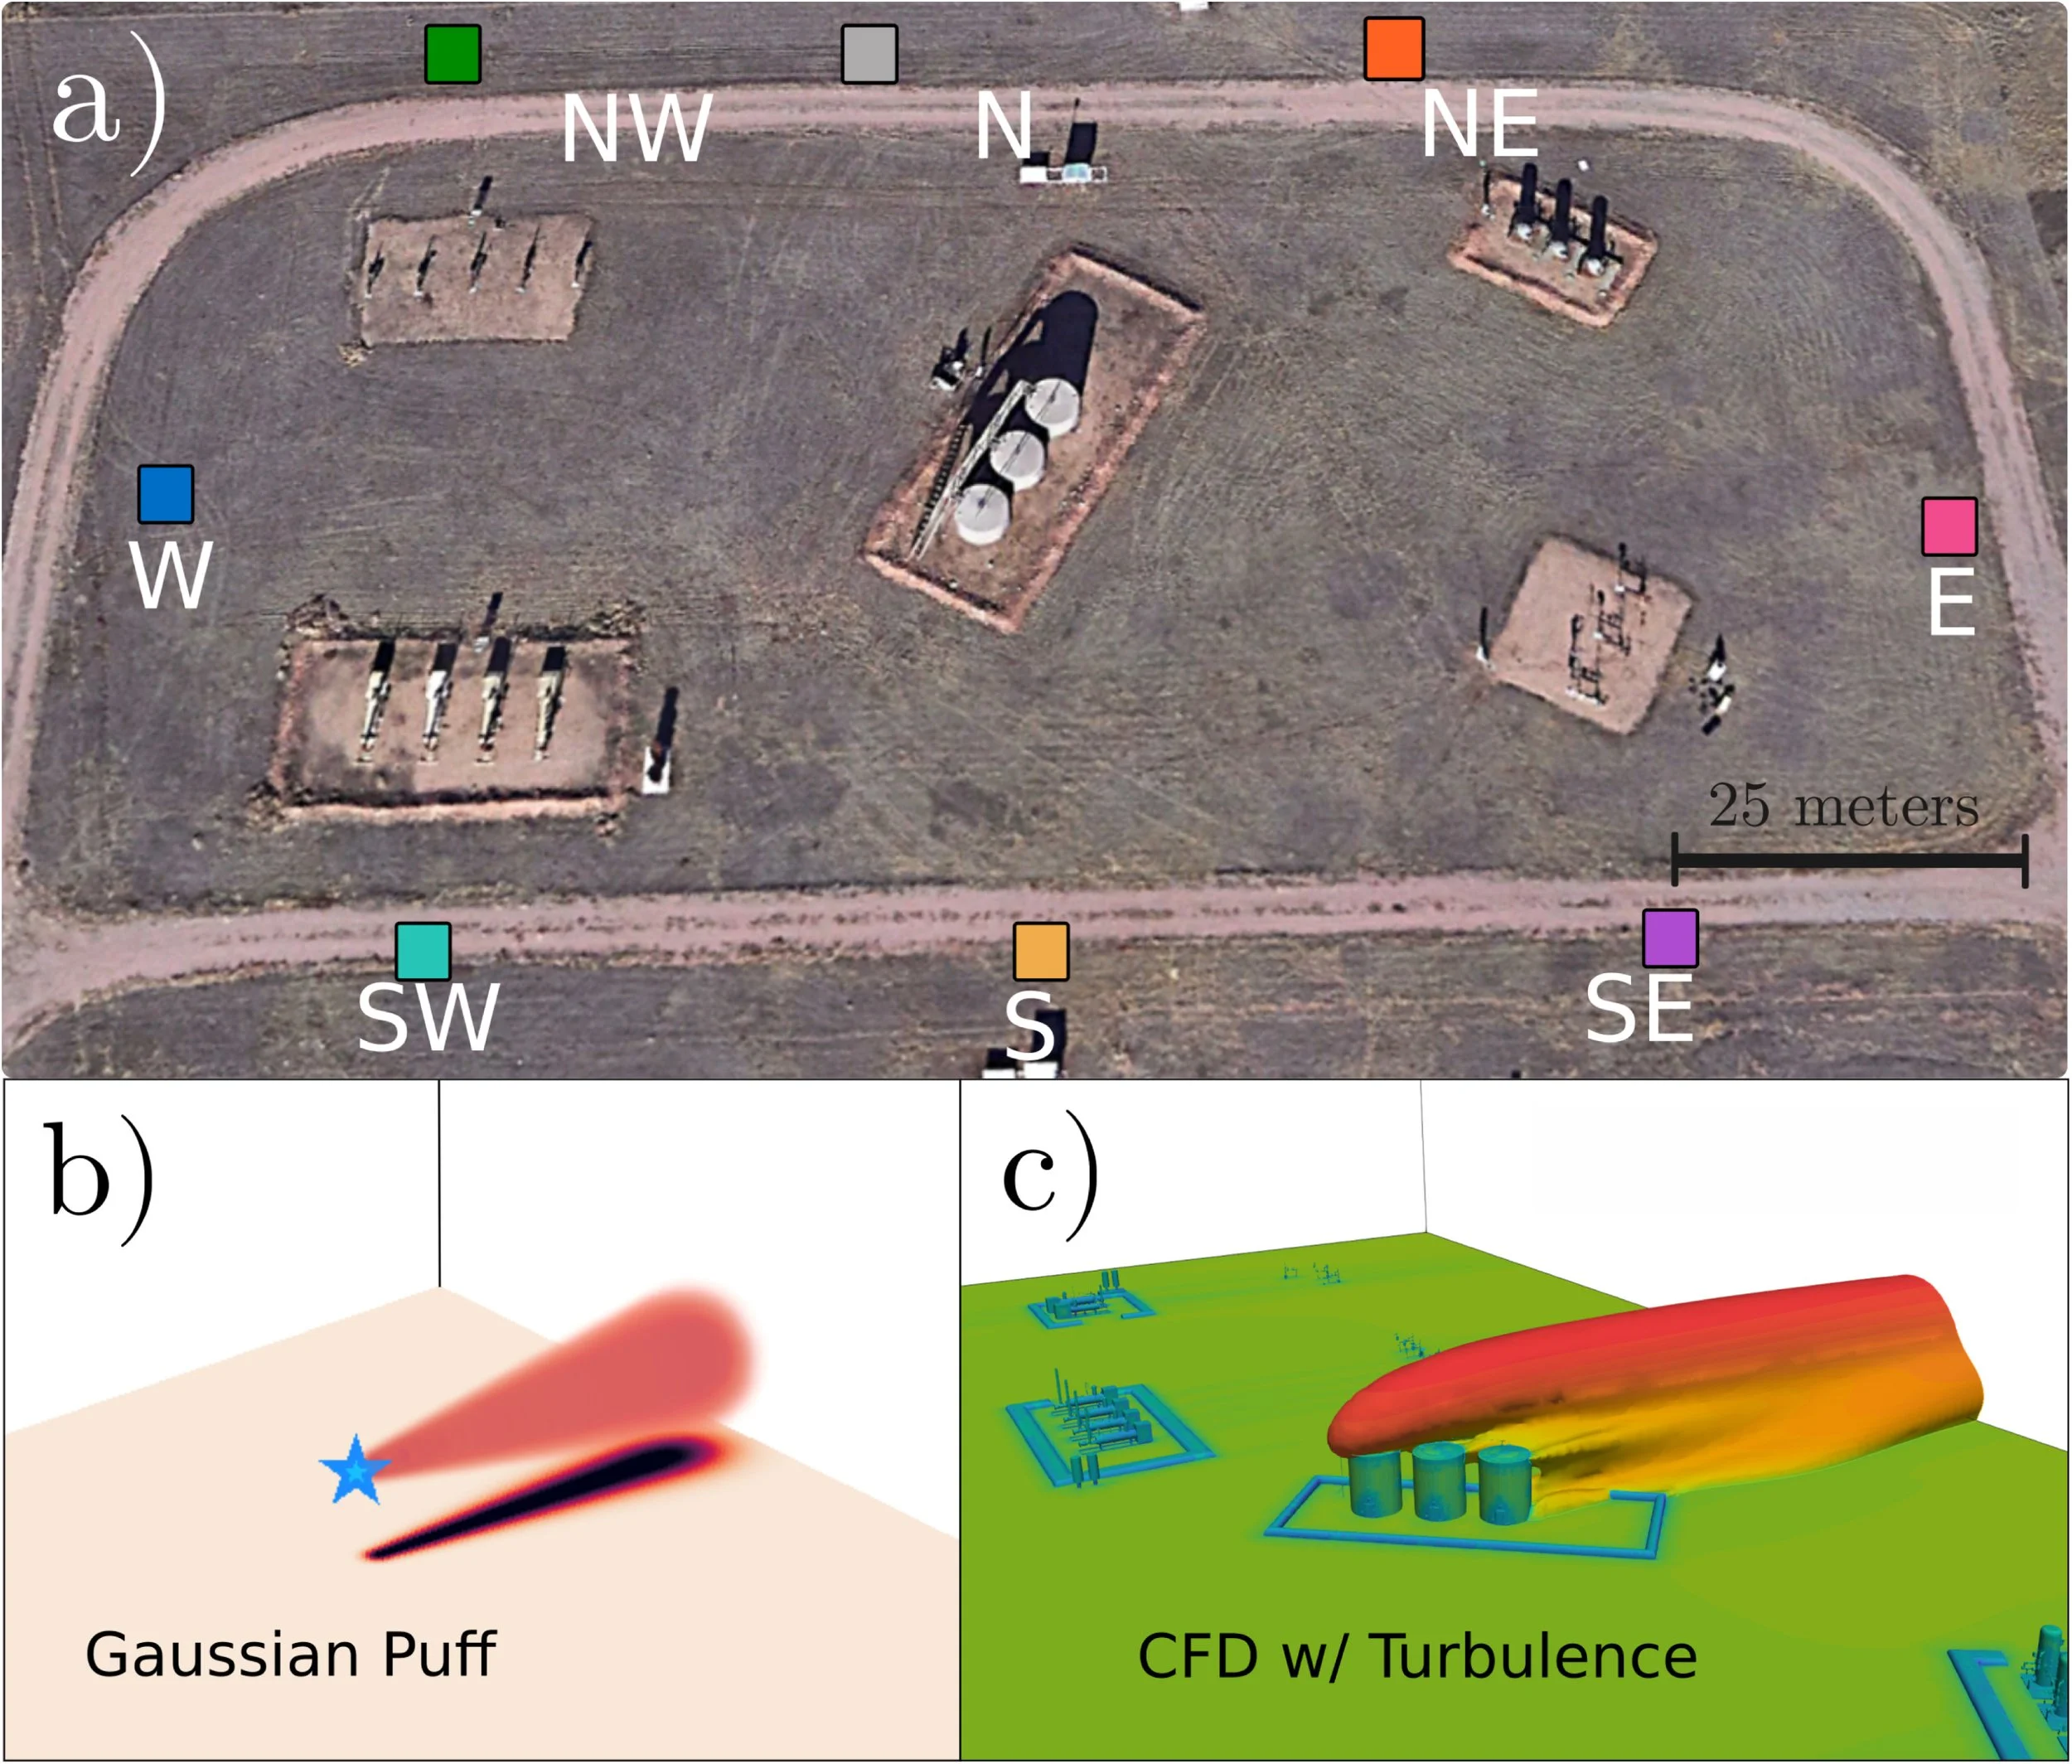
Figure 2. Gaussian puff and CFD modeling at METEC. (a) aerial image of the METEC test site with sensors shown as colored squares. (b) A simulation of methane emissions using the Gaussian puff model. (c) simulated methane emission on the METEC site using a CFD model created in OpenFOAM. The colormap shows turbulent viscosity created by obstacles in the domain.
Reference: Fish et al., 2025. A comparison of turbulent CFD with Gaussian dispersion models on a methane emission test site. Atmospheric Environment 27: 100326.
METEC Results
Storage tank releases: observed improvement in rate estimation
Tanks provide a straightforward test of “height” because releases often occur at the top, while sensors remain near ground level. Using the source-geometry method for tank releases, Qube’s 2025 METEC results showed:
Regression slope: 0.92 (predicted vs ground truth)
R²: 0.86
Interpreted conservatively, these values indicate low bias (slope near 1) and good explanatory power (R² close to 0.9) for elevated-source rate estimation in the tested conditions (Fig. 3).
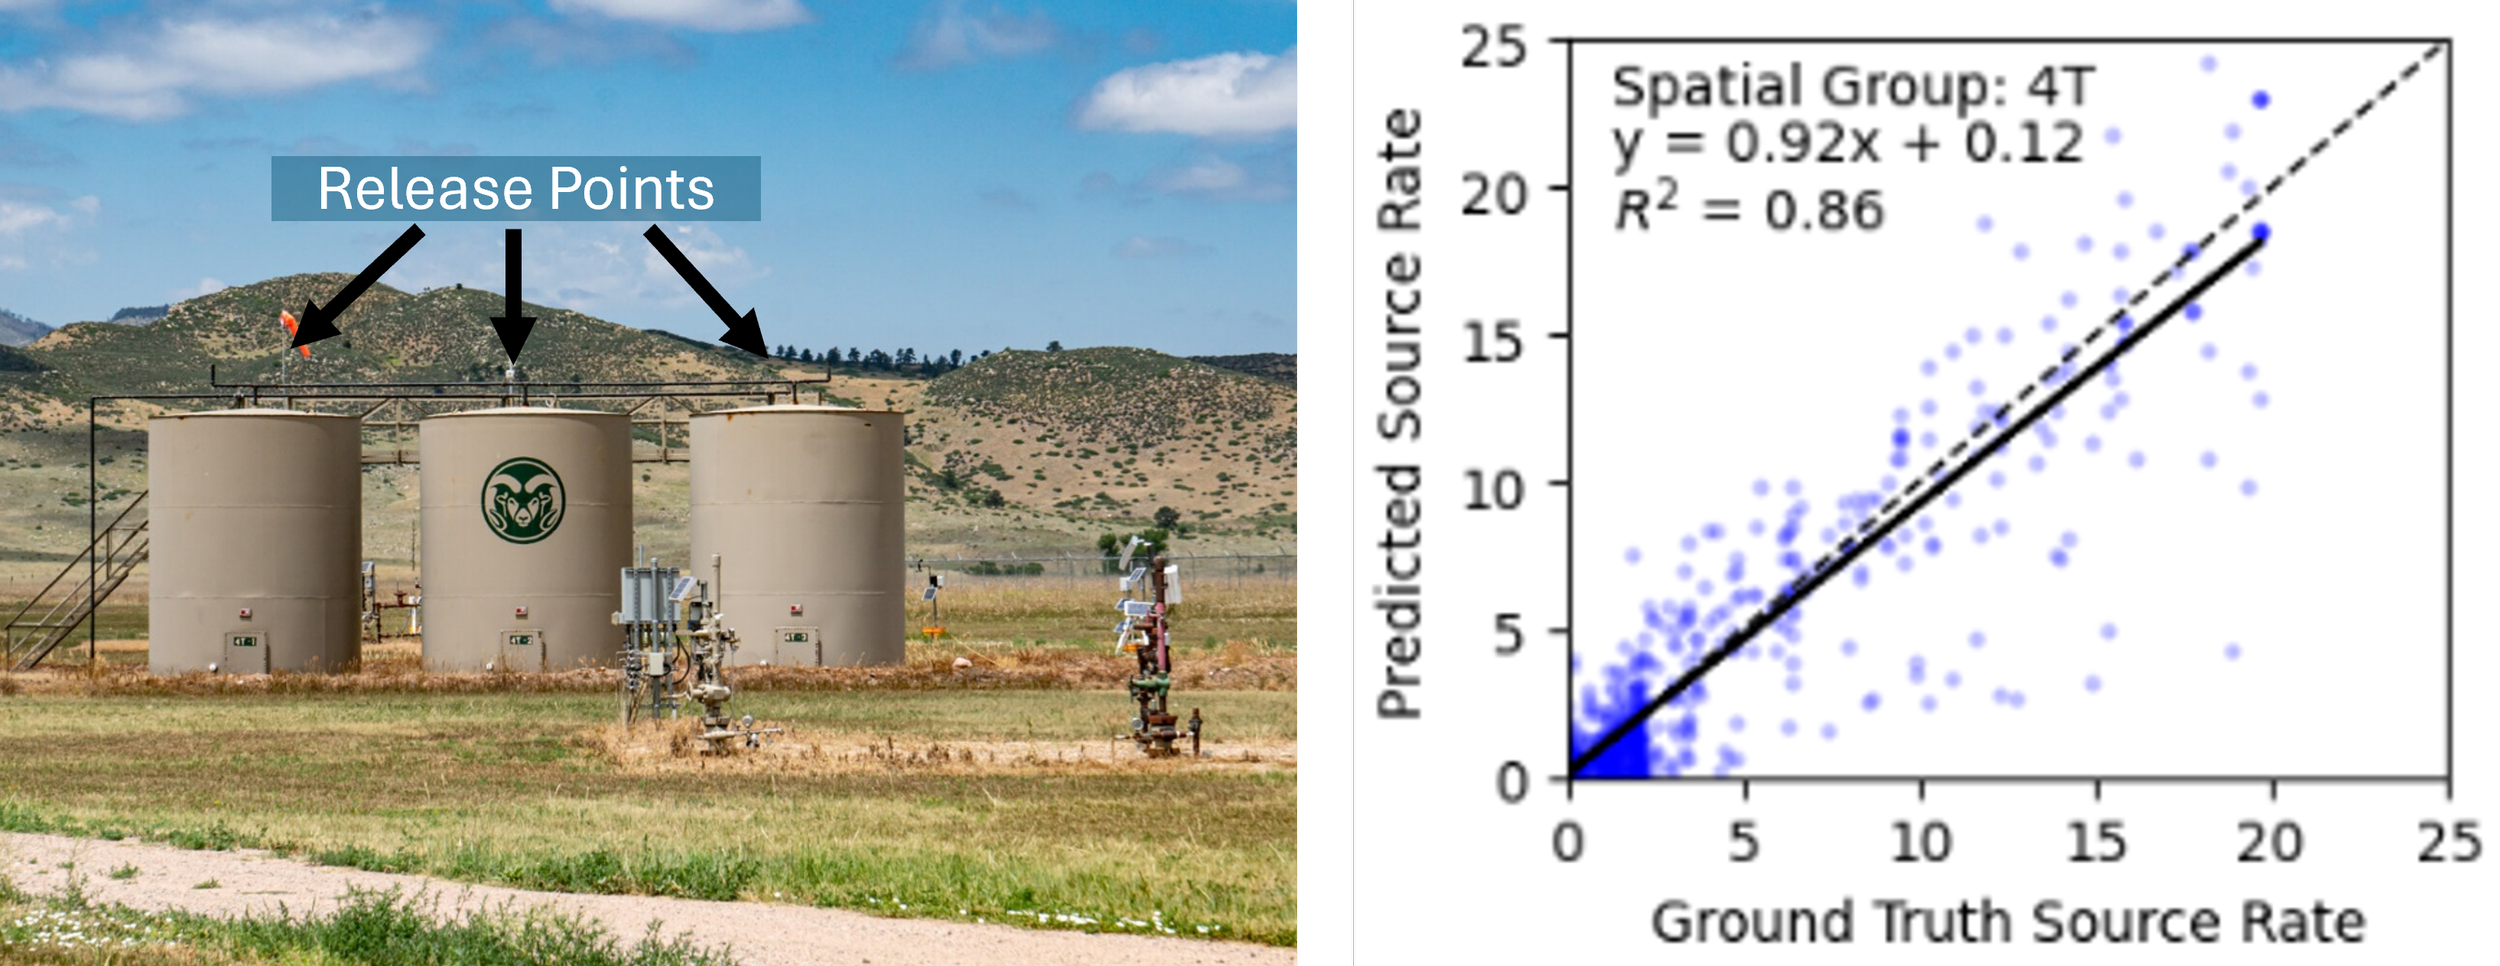
Figure 3. Predicted vs ground-truth source rates for tank releases at METEC. The image on the left shows the tanks at METEC and the height of the release points. The graph on the right shows the close relationship between predicted source rate and ground truth source rate for releases from height at the tanks. The slope of 0.92 and R² of 0.86 indicate low bias and reduced variance for elevated sources, respectively.
Successful detection of emissions from heights across the METEC site
Beyond rate estimates, time-series comparisons across the METEC test period showed that Qube’s continuous monitoring detected tank emission intervals consistently (Fig. 4).
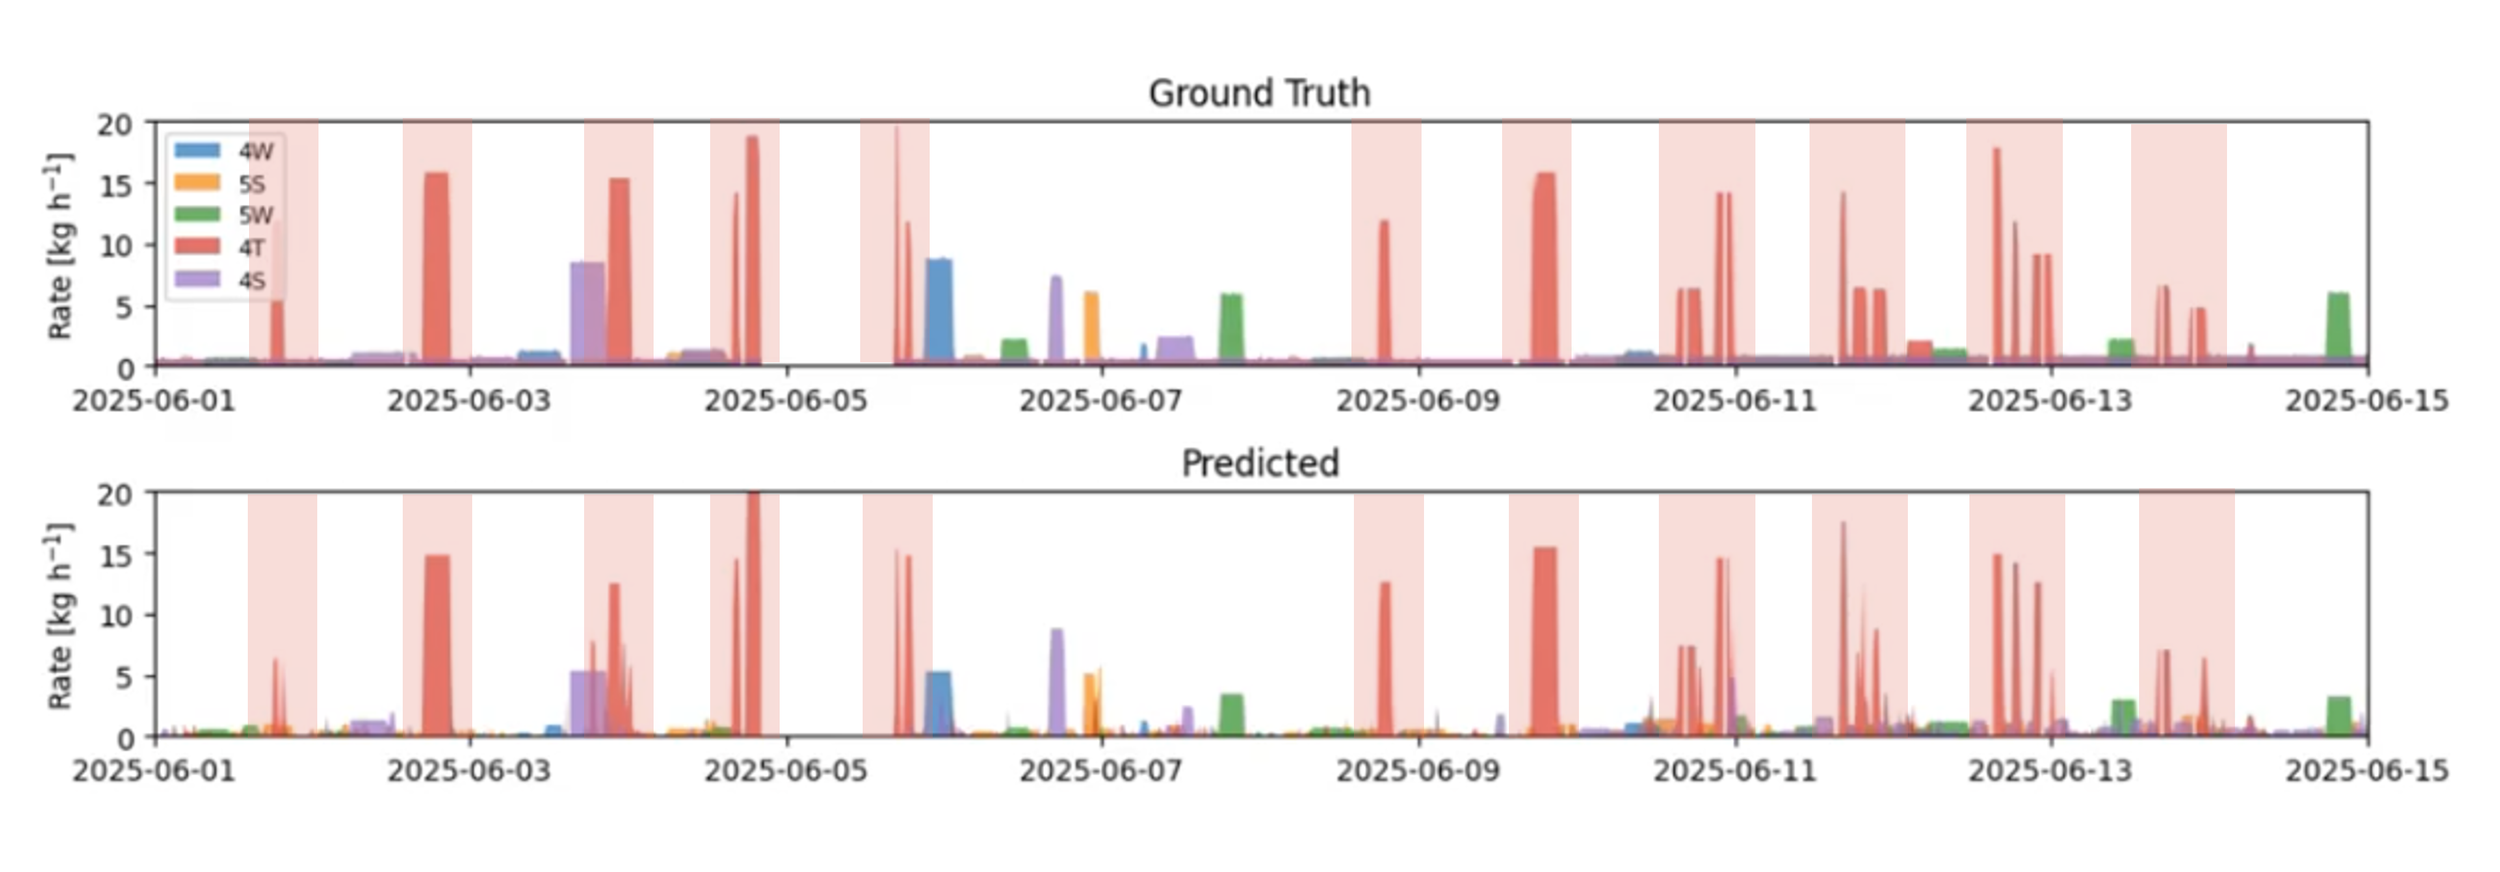
Figure 4. Comparison of ground truth and Qube’s predicted tank emissions at METEC. The tank releases are indicated in red and essentially all tank releases were detected by Qube’s continuous monitoring.
Elevated methane releases do not automatically evade ground-based monitoring. The larger technical challenge is representing near-field plume development when structures and wakes influence transport. Treating key sources as finite 3D geometries rather than mathematical points improves downwind concentration realism and strengthens rate estimation for elevated releases, as demonstrated in METEC tank top tests.
Got Questions?
If you want to learn more about these features or any Qube products, connect with our specialists at Qube Technologies.
FAQs
-
Buoyancy competes with wind-driven mixing. Turbulence and structure-induced downwash can bring methane to sensor height.
-
Large storage tanks, buildings, berms, and other obstacles can create wakes and recirculation that reshape plume paths.
-
A point source can underrepresent early plume spread caused by surface interactions and local turbulence near equipment.
-
It gives the release an initial size (a 3D shape), which better approximates near-source dispersion before the plume reaches sensors.
-
Qube uses controlled releases with known rates and locations, then compares detection timing and predicted rates against ground truth. We conduct testing at our Controlled Release Testing Facility (CRTF) as well as blind third party testing with METEC (oil and gas facilities) and FluxLab (landfill sites).
For more insights into how Qube Technologies is driving emissions reduction, explore our expert insights, white papers, case studies or reach out directly.