
Canada’s Manure Methane Offset Protocol: What Operators Need to Know
Environment and Climate Change Canada (ECCC) has published version 1.0 of the Reducing Manure Methane Emissions federal offset protocol. It now sits in the Compendium of Federal Offset Protocols alongside the landfill methane and enteric methane protocols, and ECCC has released project registration and verification report templates for it.
For operators running anaerobic digestion on dairy or swine manure, the protocol opens a credit stream tied to manure methane reductions from storage. It also sets measurement and leak detection obligations that are tighter than the March 2025 draft.
Eligible manure treatment systems under the federal offset protocol
Reducing Manure Methane Emissions, version 1.0. A project must treat eligible manure with at least one of the following systems, installed and operated on or after January 1, 2017.
| Treatment system | How it reduces methane | Key requirements | Not eligible |
|---|---|---|---|
| Chemical MTSAcidification | A chemical agent is added to eligible manure before or during storage to prevent methane production under anaerobic conditions. |
|
Systems that add the chemical agent post-storage, such as during land application. |
| Mechanical MTSSeparation | Manure is separated into a solid output stored aerobically and a liquid output with lower organic content. Both outputs carry a lower methane generation potential than raw manure. |
|
No specific exclusions set out in the protocol. |
| AD MTSAnaerobic digestion | A system engineered to maximize anaerobic methane production and capture it for energy. Manure methane is converted to biogenic CO2 by combusting the biogas. |
|
Covered manure storage structures with passive methane production and capture. |
Source: Environment and Climate Change Canada, Reducing Manure Methane Emissions federal offset protocol, version 1.0, Sections 4.1 and 4.3.
Eligibility and additionality
At least one baseline condition must hold at the project site. Either a livestock operation established at least three years before the project start date that has continuously managed liquid manure in anaerobic storage for those three years, or a dairy or swine operation established less than three years before the start date that managed liquid manure in anaerobic storage beforehand.
For the ten years before the start date, or since establishment if shorter, biogas from anaerobic storage must not have been recovered, combusted or treated in any way, including by biofilters, and the manure must not have been treated by a chemical, mechanical or AD MTS.
Each project MTS must have been installed and operated on or after January 1, 2017. Storage structures and eligible destruction devices may predate that. The project start date is the first day eligible manure enters the project MTS.
Reductions required by law are not additional, and reductions from sources already covered by a federal or provincial carbon pricing mechanism are ineligible. Biogas displacing fossil fuels can generate further reductions, though only where those fuels sit outside a pricing mechanism, the displaced equipment was in operation at the site for the three years before the start date, and the biogas is not upgraded to RNG for pipeline injection.
How monitoring and leak detection are treated
The protocol is measurement-heavy, and for AD operators leaks carry direct financial weight.
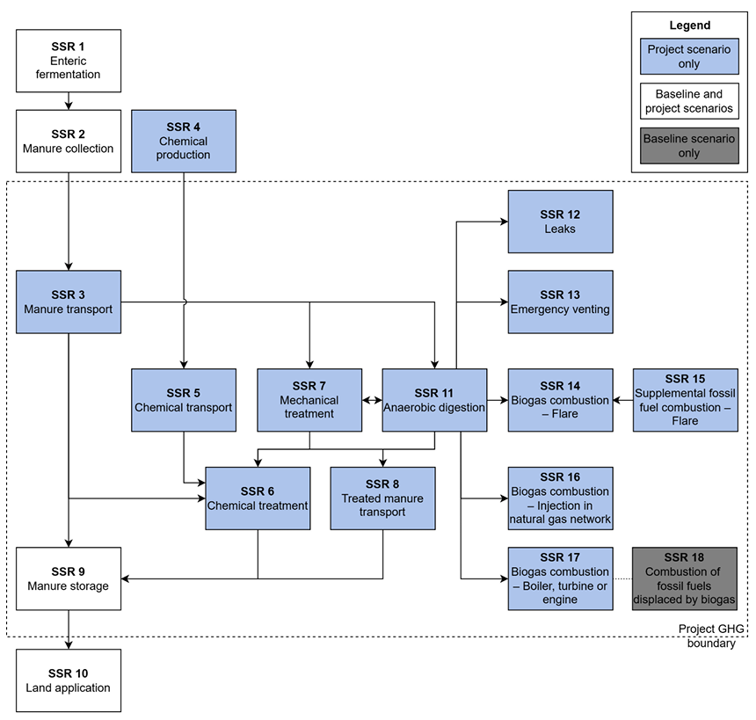
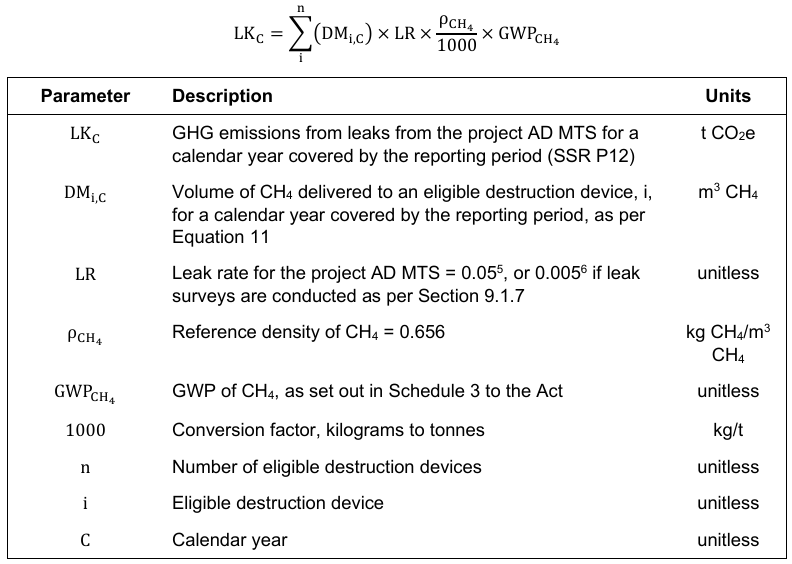
Leaks appear in the project GHG boundary as SSR 12, and defined as the release of biogas due to continuous leaks in the AD MTS. They are quantified using a leak rate applied to the volume of methane delivered to destruction devices. The default leak rate is 0.05. An operator who conducts qualifying leak surveys may use 0.005, a tenfold reduction in deducted emissions.
Source: Environment and Climate Change Canada, Reducing Manure Methane Emissions federal offset protocol, version 1.0, Section 7.0.
How to calculate GHG emissions from leaks from the project AD MTS for a calendar year covered by the reporting period.
Source: Environment and Climate Change Canada, Reducing Manure Methane Emissions federal offset protocol, version 1.0, Section 8.2.2
To claim the lower rate, the protocol requires:
Leak surveys conducted a minimum of every four months during each calendar year
Extensive leak detection across the digester and associated gas piping up to the inlet of the eligible destruction devices
Measuring devices meeting Section 6 of US EPA Method 21, or optical gas imaging capable of imaging methane at the leak definition concentration and operated per Method 21 Section 8.3
For each survey, either no leaks detected, or leaks detected and repaired with a follow-up survey within 30 days showing the leak is no longer detectable
A leak is a reading of at least 500 ppmv methane on a qualifying device, or any methane release identified by auditory, visual or olfactory (AVO) means. Miss any of these requirements and the 0.05 rate applies for the year.
Elsewhere the protocol requires continuous measurement. Manure quantity is recorded at least every 15 minutes, biogas volume and methane content on measurement periods of no more than one hour, and destruction device operational status at least once per hour. Where a project AD MTS or its monitoring instrument is not functioning properly, or operational status cannot be confirmed, no reductions can be quantified for that period. Emergency venting is quantified from the average biogas flow over the seven days preceding the event.
Where continuous emissions monitoring fits
Continuous monitoring provides real-time visibility into site emissions between scheduled surveys. Qube deploys fixed methane sensors paired with anemometers around the digester, lagoon and gas handling equipment. Concentration and wind data feed a physics-based dispersion model that localizes and quantifies emissions. When emissions are detected, an automated alert points operators to the source area.
Qube’s model considers multiple emissions sources. It resolves several concurrent sources at different rates, where a single-source model would collapse them into one most likely location. Large lagoons and biogas facilities typically have several active sources at once, so this improves both localization accuracy and the quantified rates.
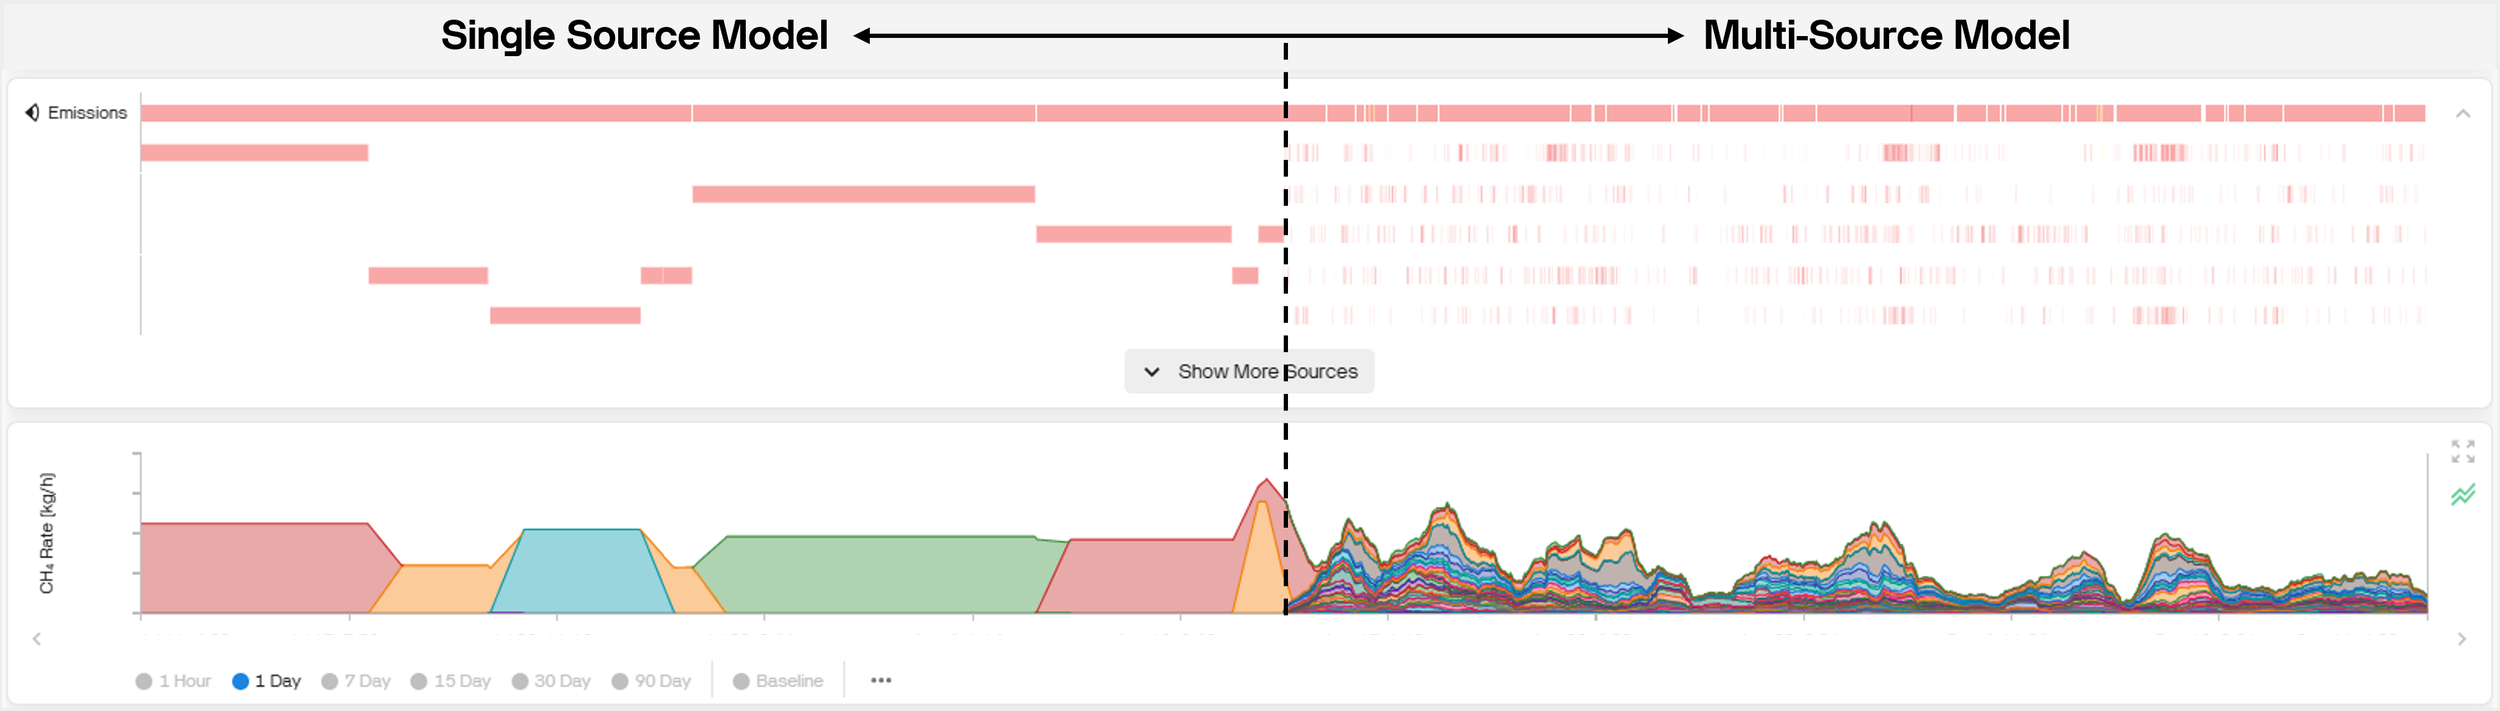
Here is a real example of the same site’s emissions measured with a single source model and then with a multi-source model. A single-source model assigns the entire measured signal to one location, usually the strongest apparent contributor. A multi-source model separates concurrent sources and estimates a rate for each, so a site with several active leaks resolves as several leaks. Operators see the location and relative size of each one, which determines where a crew goes first.
The two case studies below show how this performed at an unlined RNG pond and a lined biogas lagoon, respectively.
Case Study #1: Leak detection at an unlined RNG pond
At an unlined RNG pond with a clay bottom, Qube Fenceline devices detected leaks at the outer lagoon perimeter seams where the underlying soil had not compacted properly. Gas was dispersing through soft soil and surfacing at concentrations too low for walking surveys to catch. After recompaction, monitoring verified a 67% decrease in methane.
Read the full details here
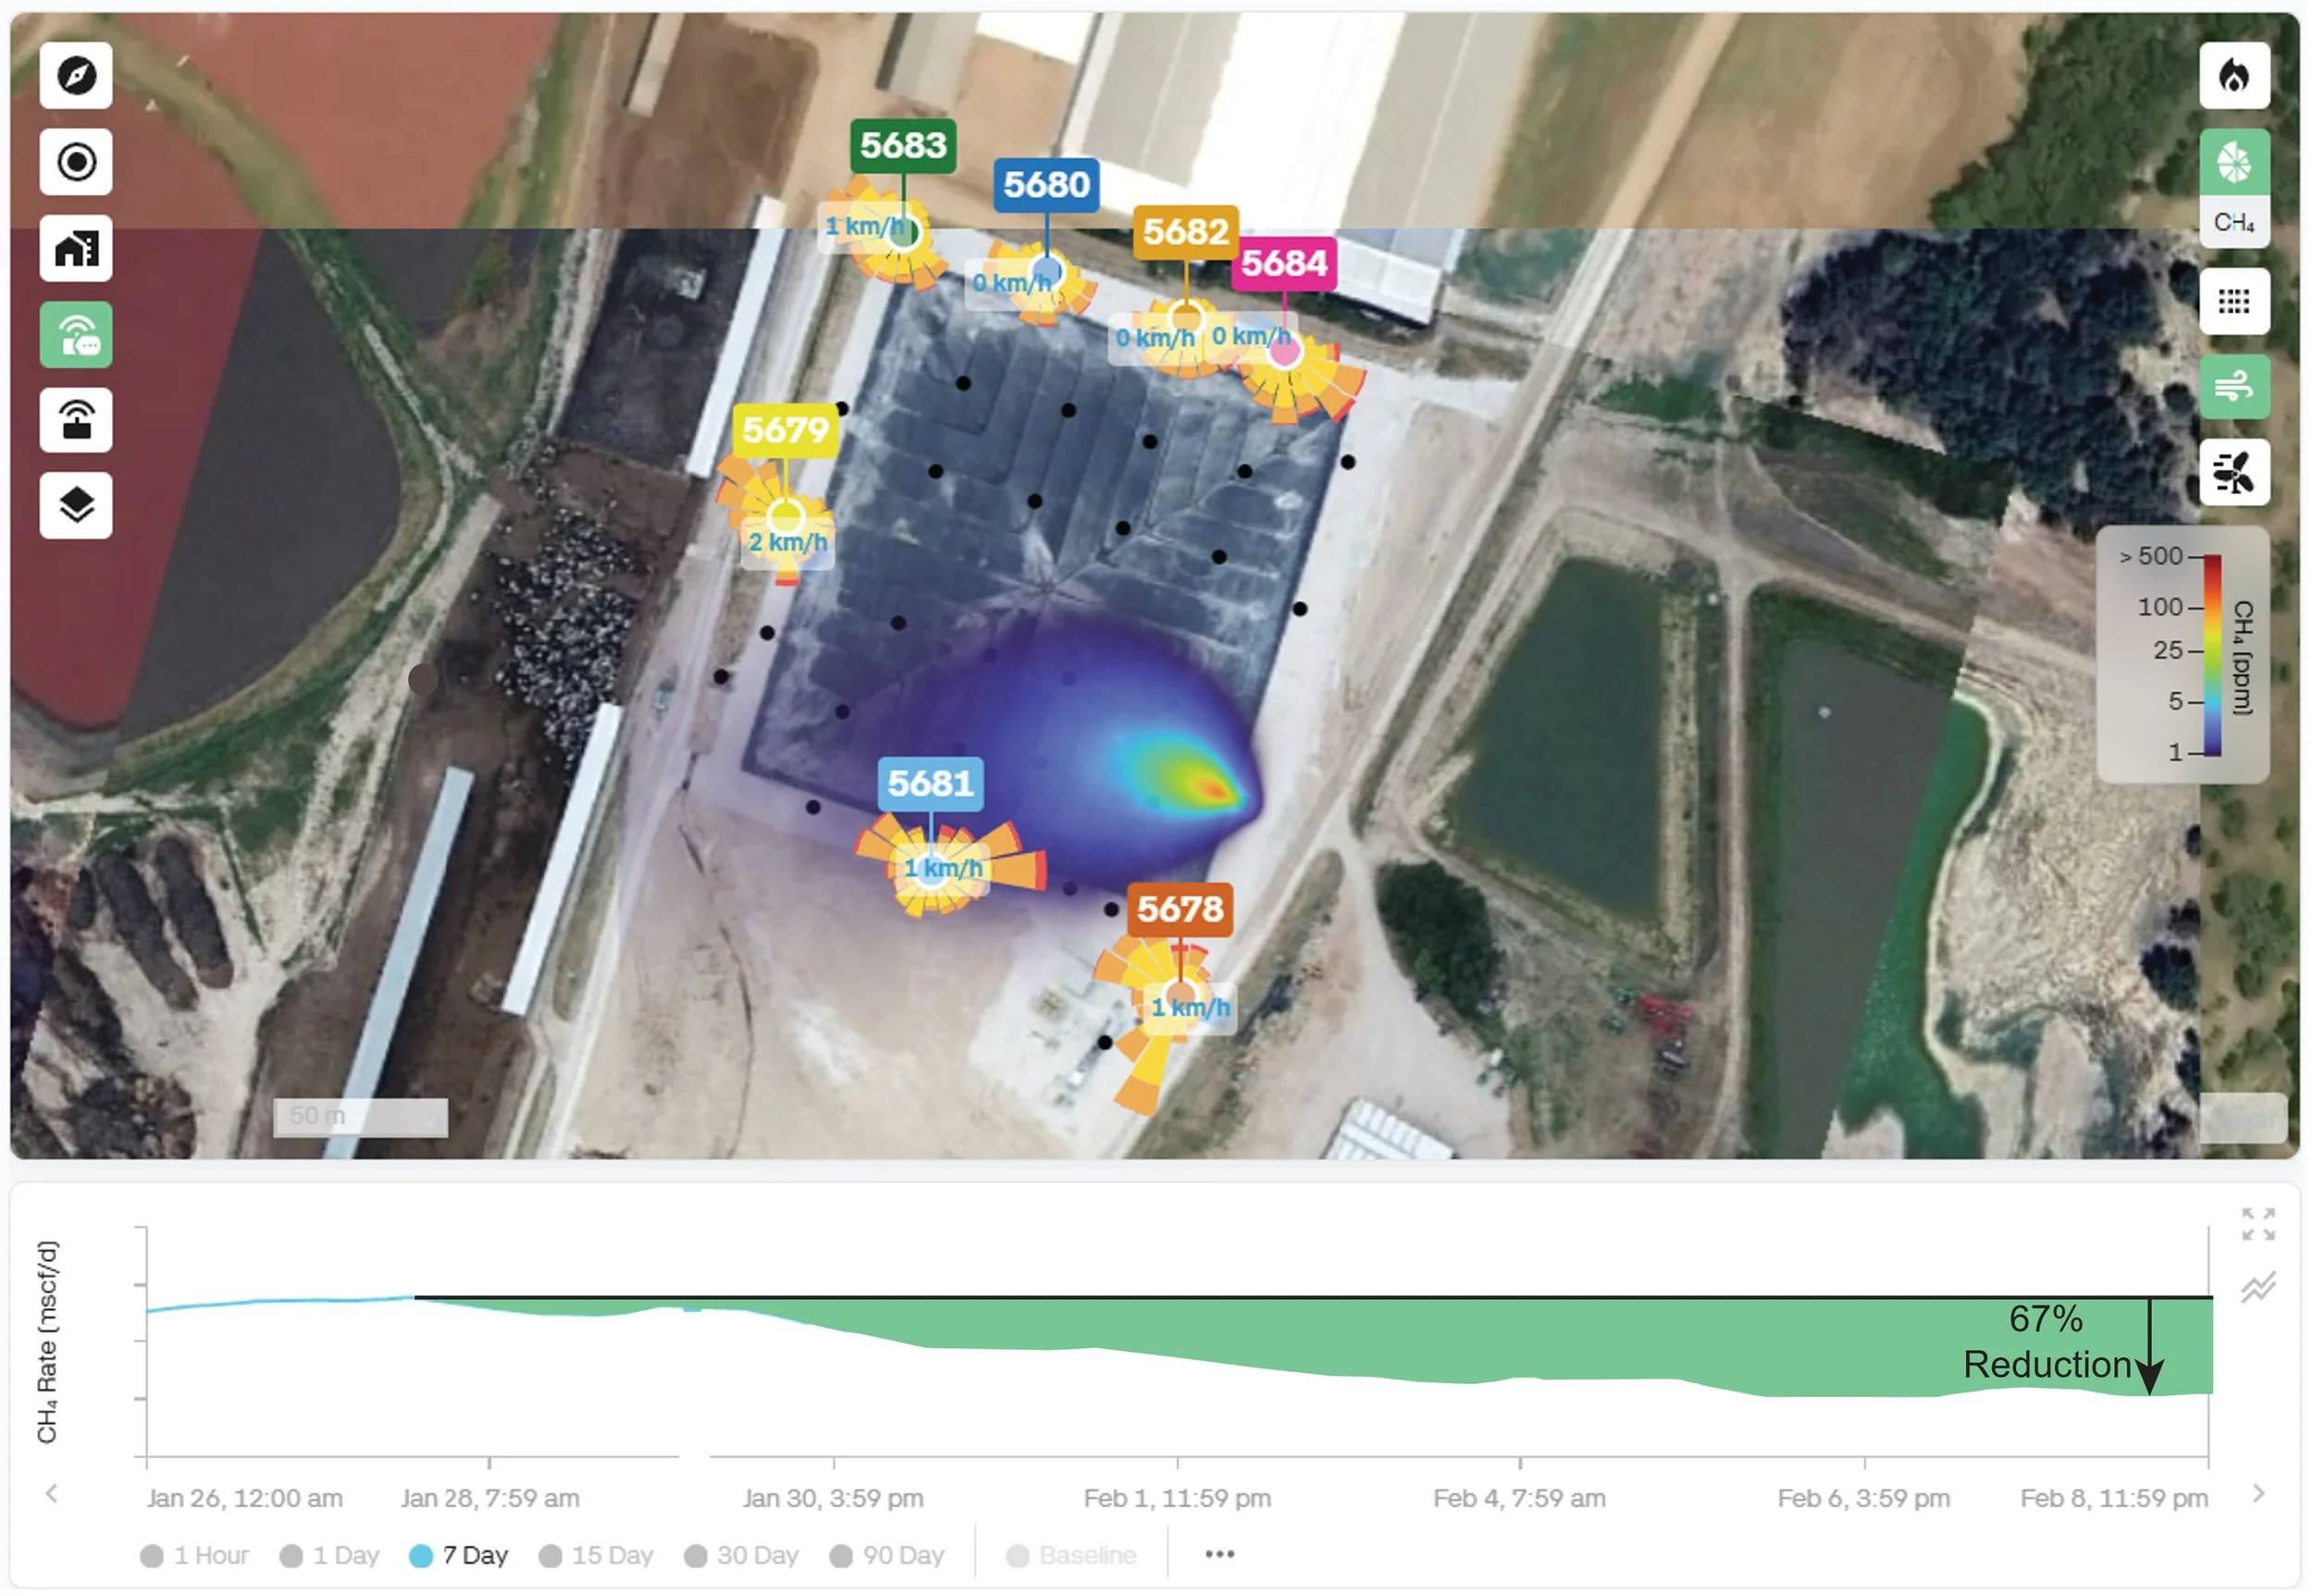
Qube’s continuous methane monitoring devices identified small, otherwise undetectable perimeter leaks from uncompacted soil at an unlined lagoon. Using Qube’s real-time data, operators localized and repaired problem areas, reducing methane emissions by 67%, while minimizing inspection time and labor.
Case Study #2: Leak detection at a broken weld
At a lined biogas lagoon, crosswind from an adjacent open manure lagoon had complicated detection, and walk-by inspections had repeatedly missed the source. Qube's model identified persistent emissions from a section of cover that operators had walked past many times. The cause was a broken weld at the sludge port. After repair, methane fell 87%, and monthly gas production rose by more than 1,000 MMBtu between August and September.
Read the full details here
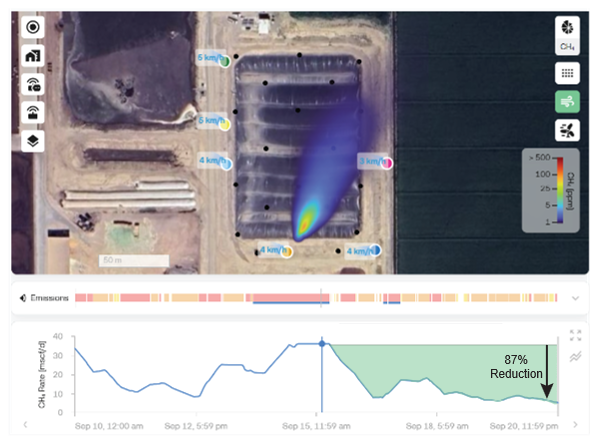
Qube’s continuous methane monitoring devices detected persistent methane emissions near the south end of the lagoon cover, visualized via the platform’s simulated plume display. Post-repair monitoring verified a sustained 87% reduction in CH₄ emissions. These results demonstrate Qube’s capability to both detect emission events and confirm the effectiveness of mitigation efforts in real time.
How do these case studies relate to the new protocol?
In the first, a leak found and repaired between scheduled surveys is a leak the four-month survey does not find. Under this protocol, that is what keeps a project on the 0.005 leak rate.
The second adds a revenue benefit. Methane that was escaping is now gas delivered, which increases both saleable product and the volume of reductions available for credit.