
Qube Platform Releases 2.66: Improved Inspection Workflow
Releases 2.66 is out now! The update focuses on inspections: a single form for ground and aerial surveys, a wider set of detection methods, inspection outcomes on your emissions timeline, and a slideout that holds the full inspection record.
Want to see how it works?
One Inspection Form for Ground and Aerial Surveys
Ground and aerial surveys now share a single inspection form. Choose the deployment method that matches how the survey was carried out, then choose the detection method the crew used. The form covers AVO, LiDAR, OGI, and TDLAS.
To set it up:
Click 'Add Inspections' from either the Overview or the Site Dashboard.
Choose Deployment Method: 'Ground' or 'Aerial'.
Choose Detection Method: 'AVO', 'LiDAR', 'OGI' or 'TDLAS'.
Complete the required fields, including Inspection Date and Site, then save the inspection.

From the Overview or Site Dashboard, go to the Event Log, click on Inspections, and then select “+ Add Inspections”.
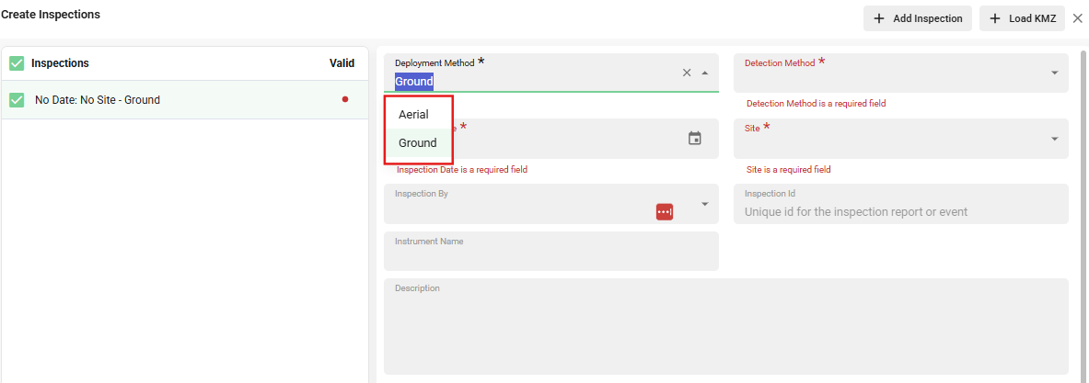
Select “Aerial” or “Ground” under Deployment Method.
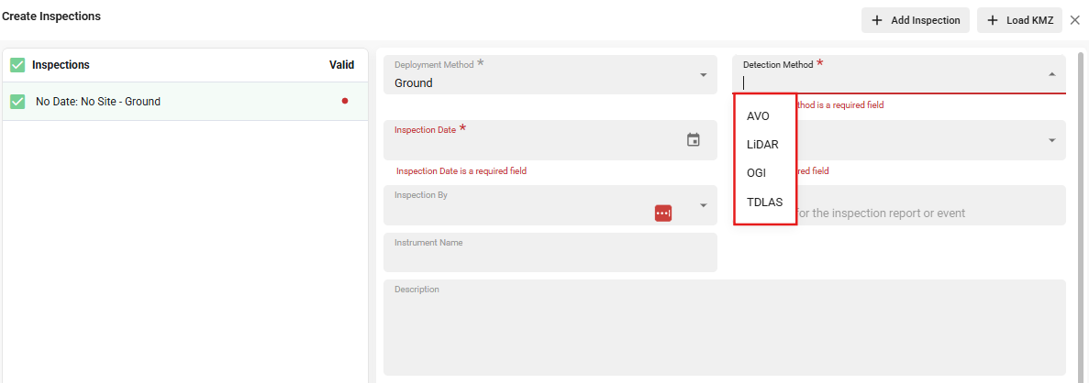
When Ground Deployment Method is selected, choose the specific detection method - AVO, LiDAR, OGI, TDLAS.
Inspection Outcomes on the Emissions Timeline
Inspection results now carry their outcome on the Site Dashboard. Red dots and pins mark an inspection where emissions were detected. Blue dots and pins mark an inspection where none were found. The markers appear on the Inspections row of the emissions timeline and on the site map, so every survey sits alongside the corresponding measurements.
To view it:
Open the Site Dashboard for the site.
Find the Inspections row on the emissions timeline.
Red indicates detection found. Blue indicates no detection.
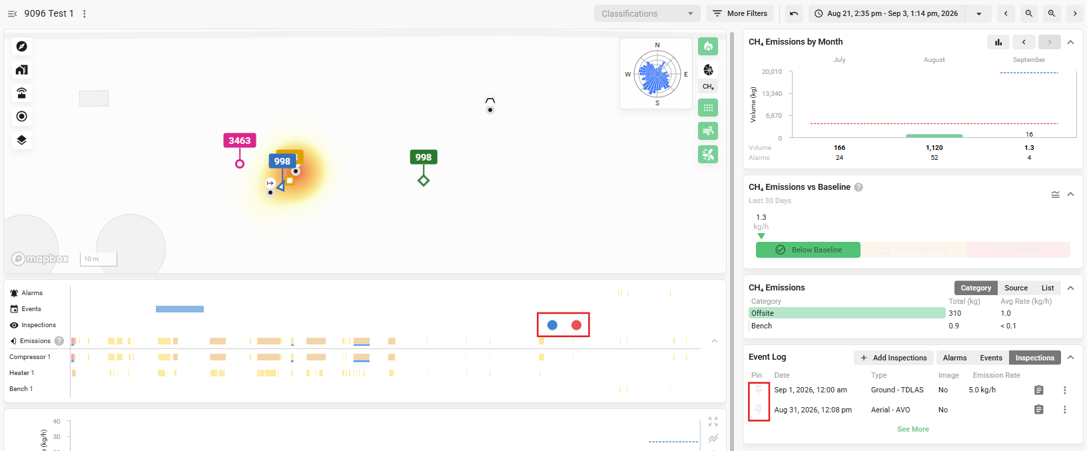
Red dots and pins indicate emissions found, blue indicates no detection.
The Inspection Slideout
View and Edit now open an inspection slideout holding the full record in one panel: deployment and detection method, inspection date, site, inspector, detection location, detected CH4 rate and concentration, and attachments.
To open it:
Open the Event Log on the Site Dashboard and select the Inspections tab.
Choose View or Edit on an inspection.
Update any field in the slideout and click Save.
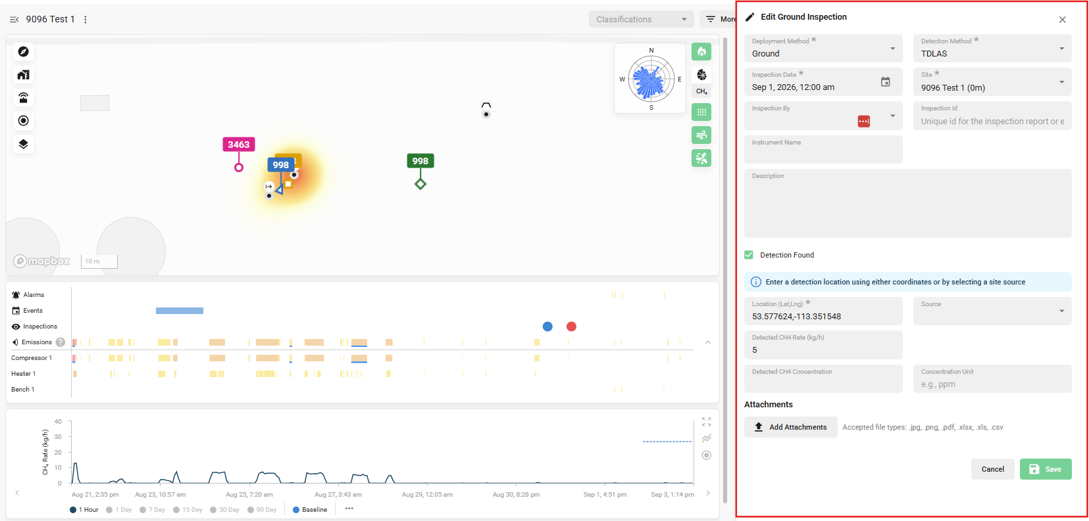
View or Edit functions now open a detailed inspection slideout.
Zoom to Inspection
Zoom to Inspection frames all measurements on a two-week window centered on the inspection date.
How to do it:
Click on the inspection circle in the timeline
Select “Zoom to Inspection” on the drop down menu

Clicking on the inspection in the timeline brings you to a dropdown menu where you can select “Zoom to Inspection”.