
How Continuous Monitoring Found an Underground Pipeline Leak
An underground leak on a third-party gathering line produced no surface signature and no obvious source on the pad. Two field inspections found only minor equipment issues. Qube's continuous monitoring data kept pointing to the same location, and the source was identified within 48 hours of the team mobilizing.
Introduction
Underground pipeline leaks produce no visible surface signature. There is no audible hiss, no vapor cloud, and nothing for a technician to find on a walkthrough. When a Colorado upstream operator's Qube monitoring system began flagging elevated methane at a producing pad, the first two field investigations turned up only minor equipment issues. The data kept pointing to the same location anyway, and the third visit found the actual source.
Detection: Sustained, Elevated Emissions
Qube’s monitoring recorded the start of the event at 9:22 pm on June 10th. Methane readings rose above baseline across several sensors and did not come back down, with the CH₄ rate peaking above 25 mscf/d. Routine operational venting shows up as short spikes so that was ruled out. Automated alarm notifications went to the operations and LDAR teams, and a site visit was dispatched.
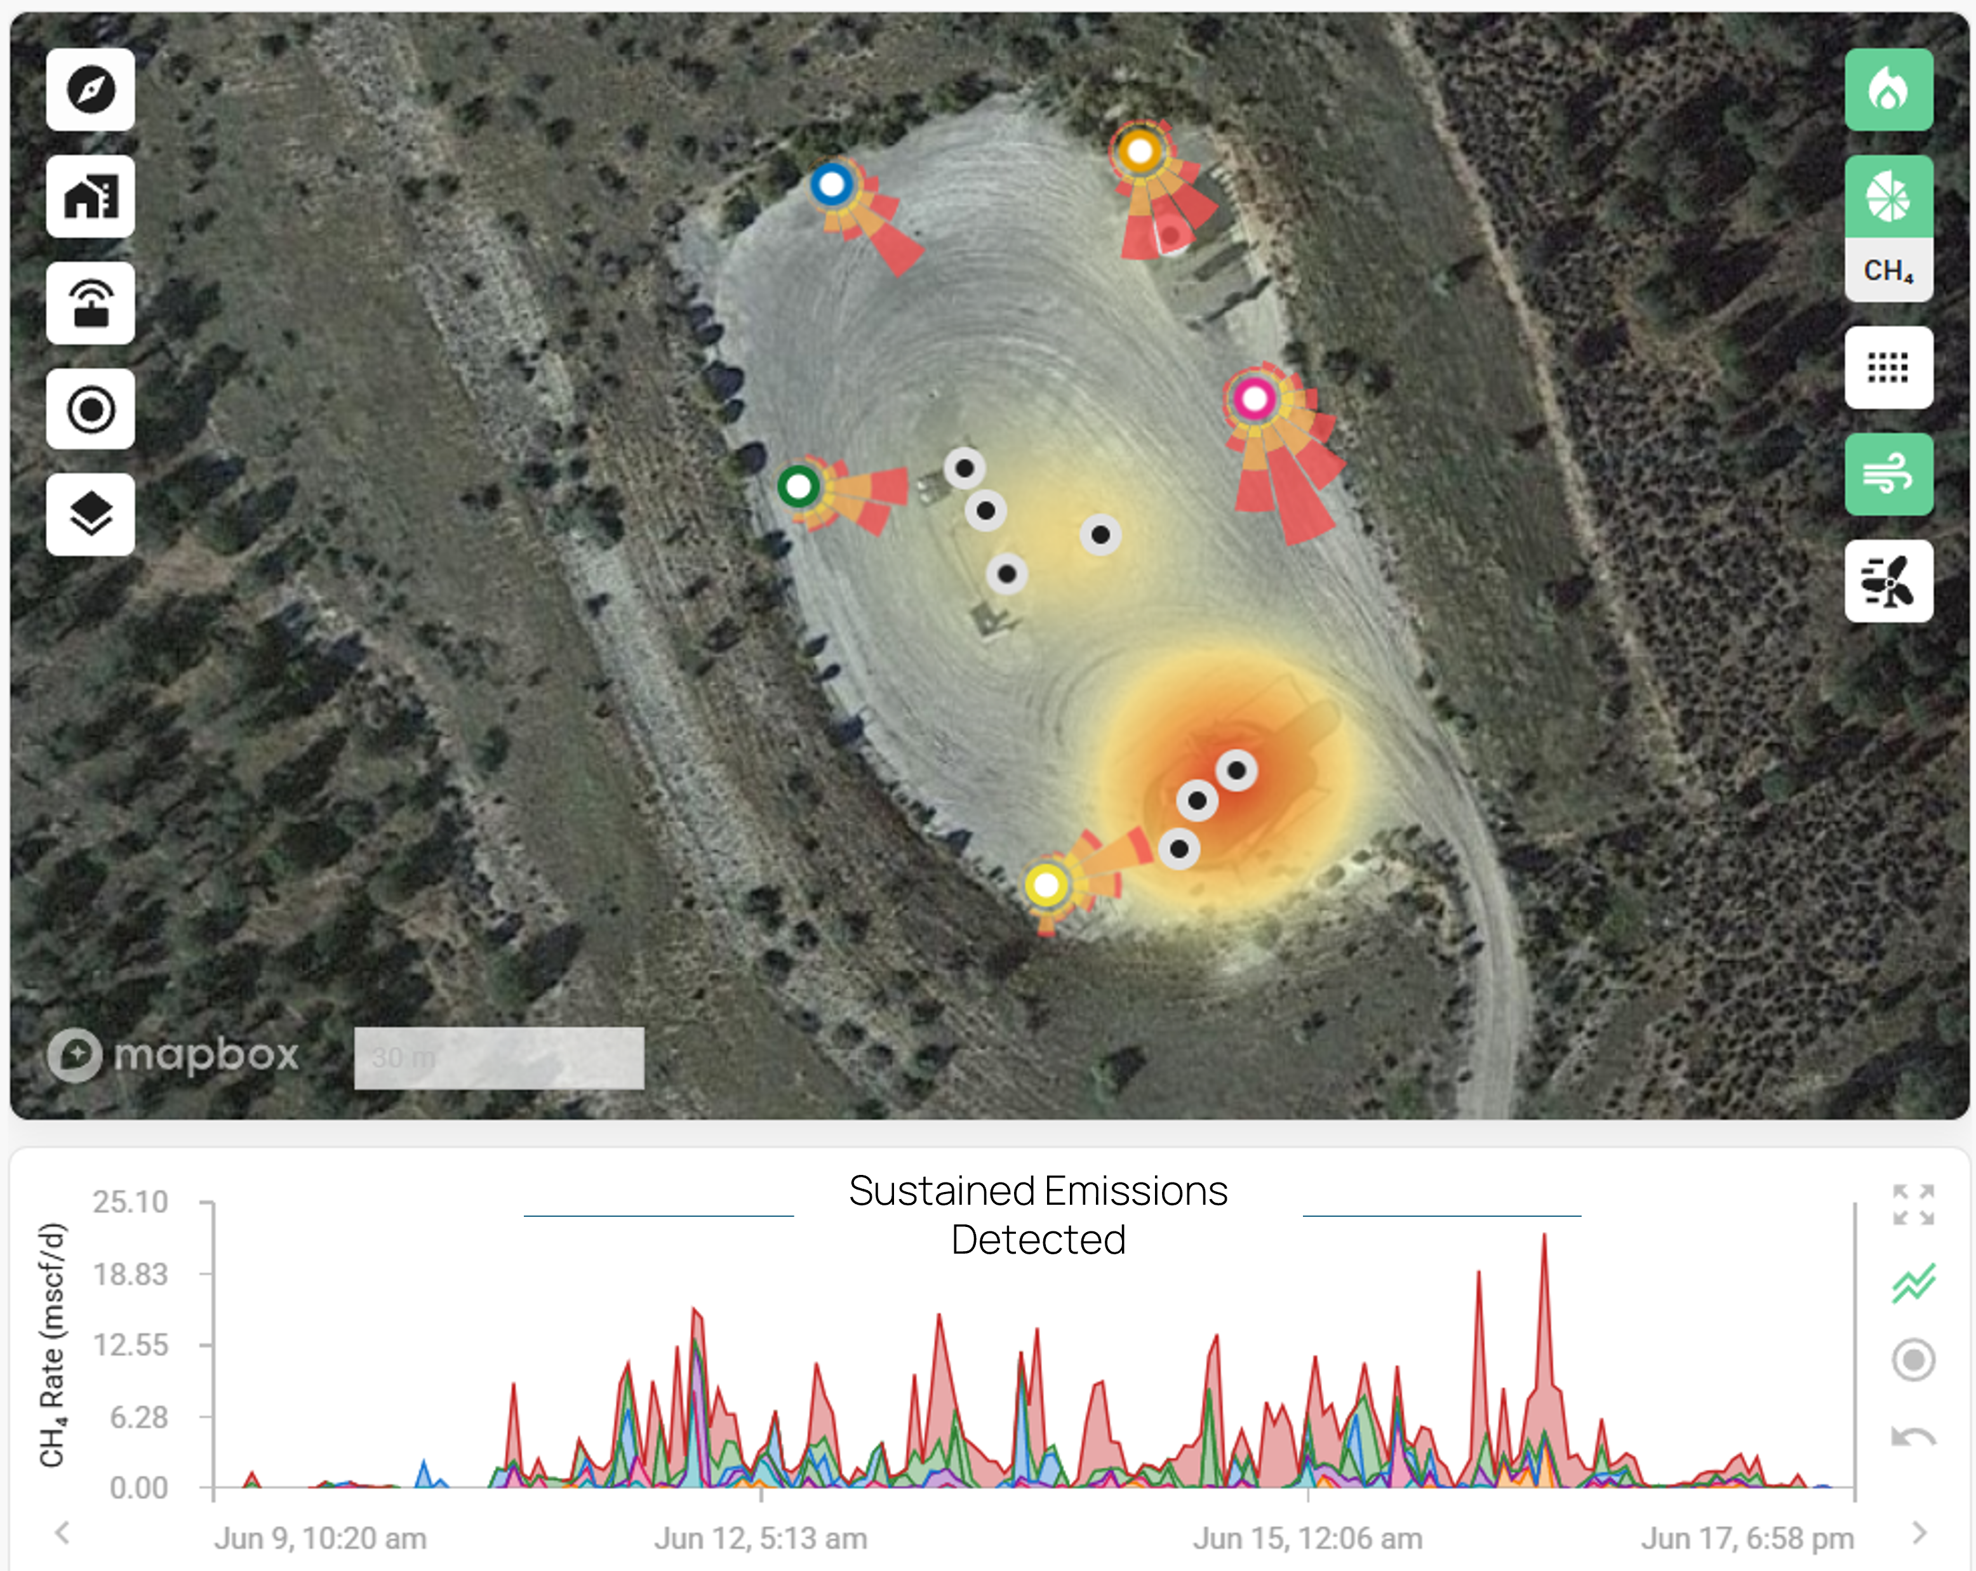
Qube Fenceline devices deployed at the site detected emissions released and localized the source to the southwest area, as indicated by the heat map and rose diagrams.
Investigation: Connecting the Data Streams
The field team identified several leaking dump valves on the pad and repaired them. The expectation was that emissions would come down. Overnight monitoring showed the same elevated readings continuing, from the same area of the pad.
The dump valve repairs had addressed valid equipment issues, but the monitoring system was still flagging the same location. As the operator put it: "Our faith in the Qubes is undeterred." The team returned to the platform rather than closing the event out.
Localization: Emissions Outside the Equipment
Qube's platform models emissions concentrations across the sensor array and localises them spatially. The heatmap showed a single concentrated hotspot at the southern end of the pad, near the entrance, distinctly separate from the tank and separator equipment at the north end where the dump valves had been repaired.
That spatial separation was the diagnostic signal. The source was not on the production equipment at all.
The third field investigation, directed by the heatmap localisation, found a significant underground leak on a third-party gathering line near the entrance to the pad. From the point the team mobilised to the point the source was identified was roughly 48 hours, across three separate visits. The pad was shut in and the pipeline operator was notified for remediation.
Outcome
The platform's event tracking view holds the full history of the event in one place, from first detection through to the point emissions returned to baseline. The slideout shows the start and end timestamps, the fugitive classification, the quantified total of 28 mscf, and the LDAR team's field note recording what was found and when. The event also renders as a continuous bar on the timeline beneath the map, so anyone opening the site can see the duration and severity at a glance alongside the alarm and emissions activity underneath it.
When the source belongs to another company, the operator carrying the monitoring costs has to be able to show what happened. Establishing when a leak started, how long it ran, and how much gas was released is the difference between an assertion and a documented claim. The operator was able to attribute the event and pursue cost recovery for the monitoring period because the evidence was already assembled.
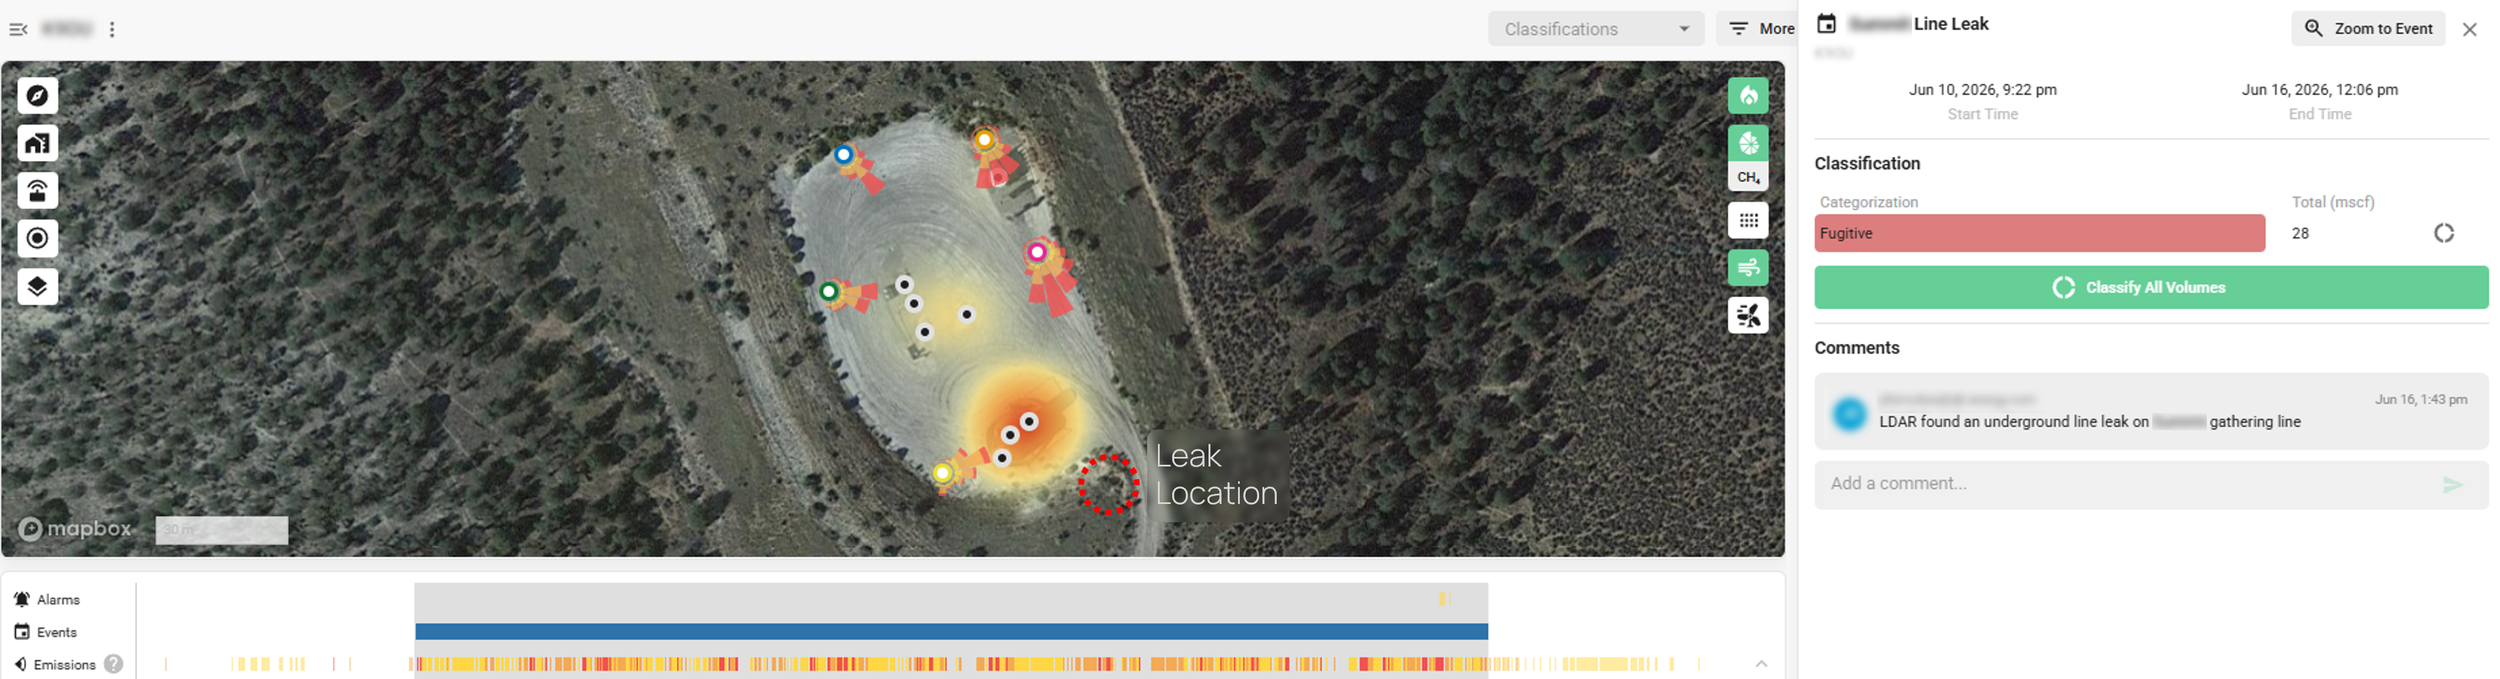
The operator created an event in the Qube platform for this pipeline leak (indicated by the blue bar on the timeline). The details of the event are captured in the event slideout (right panel). It captures the timing of the event, emissions type, volume, and any details captured by the operator.
Key Takeaway
Two things made this outcome possible. First, the team trusted the persistent emissions alarms from Qube’s platform, even after visiting the site twice. Second, Qube’s platform localized emissions to the correct area even though there was no equipment in that area.
Without continuous monitoring, an underground leak on a pad with no surface signature has no obvious trigger for detection. It would have continued until the next scheduled survey or until someone happened to notice.
Interested in how Qube Technologies can help you reduce risk and operational costs across your asset base?
FAQs
-
Gas escaping from a buried line migrates through soil and disperses at the surface over a wider area rather than venting from a single visible point. Visual and auditory cues are suppressed by the ground. Standard LDAR survey methods are designed for above-ground components: flanges, valves, connectors, and thief hatches. An inspector walking the pad has nothing to point an instrument at. Detection depends on measuring the resulting methane concentration in ambient air, which is what a continuous monitoring array does.
-
The heatmap localised the concentration to the southern end of the pad, near the entrance. The tank and separator equipment where the leaking dump valves were found sits at the northern end. The emissions continued at the same rate after the repairs were completed, ruling out the repaired components as the ongoing source. Without spatial resolution, the team would have had a site-level emission rate and no way to distinguish between the two areas. An aerial survey would have detected these emissions as well. But the trade off is that it would have been detected during a scheduled inspection rather than when the emissions first occurred thus extending the leak period.
-
It is the total volume of methane released across the full event, from onset through to the point emissions returned to baseline. The platform calculates emission rates continuously by combining sensor concentration readings with wind data and atmospheric dispersion modelling, then integrates those rates across the event window. Having a quantified volume attached to a defined time period is what makes third-party attribution and cost recovery practical.
-
When the source of an emissions event belongs to another company, the operator carrying the monitoring costs needs to be able to demonstrate what happened. A timestamped record showing when the leak started, how long it ran, the quantified volume released, and the field findings from the LDAR team gives that operator a documented position rather than an assertion. In this case, the operator notified the pipeline company and pursued recovery of the monitoring costs for the month.
-
The event remains in the site's history with its classification, volume, timestamps, and comments intact. That record supports internal reporting, regulatory documentation, and trend analysis across the asset base. It also means that if a similar pattern appears at the same location in the future, the team has a reference point to compare against.