Emissions Detection at a Geothermal Power Plant
Summary
One of the largest power producers in Indonesia implemented Qube‘s continuous monitoring solution to monitor for H2S gas at a new geothermal facility.
Customer Challenge
National Energy Services Reunited Corp. (NESR) is one of the largest national oilfield services providers in the Asia Pacific region. Recently, a NESR client in Indonesia contracted the company to provide integrated well construction, evaluation, and completion services for new geothermal wells, as part of a key facility expansion.
The facility is located on a remote island in Indonesia, and is of particular focus for H2S hazardous gas monitoring given its proximity to a local village & school.
The customer’s primary objective was real-time, continuous monitoring of H2S to alleviate safety concerns, including data comparison to heritage sensor technology also deployed at the geothermal plant.
The solution
As part of the expanded scope of the integrated well construction service delivery, NESR deployed the Qube Continuous Emissions Monitoring solution to:
monitor H2S concentration within the facility & a nearby village, and
measure CH4 emissions in conjunction with forthcoming greenhouse gas (GHG) & carbon policy in Indonesia.
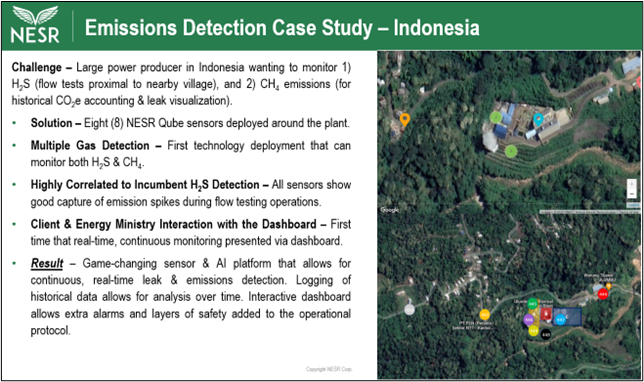
NESR deployed eight Qube devices, each equipped to measure CH4, H2S, and key environmental conditions including wind speed & direction, temperature, and relative humidity. Wireless communication provided real time, continuous data transfer from each solar powered device to Qube’s cloud based emissions dashboard.
Five of the sensors were deployed in and around the geothermal facility, surrounding the producing wells, while two sensors were deployed immediately outside of the facility to measure emissions originating from outside of the geothermal wells. The final sensor was deployed in a nearby village to measure air quality and emergent H2S events.
Qube Emissions Detection Case Study Summary - Courtesy of NESR
The Results
Robust, Self-Powered Qube Sensors:
Although the remote Indonesia location was challenged by rainy weather and topographical impediments to direct sunlight, NESR engineers were able to deploy all eight sensors and adjust the angle of the solar panels to optimize energy capture. The entire Qube deployment was adequately powered for the duration of the multi-week pilot.
Strong Correlation to Existing H2S Detection:
H2S event detection correlated strongly with well flow test intervals and with incumbent detection alarms (which evidently do not provide real-time data visualization & storage of historical data). The sensor nearest to the village detected minor events, but nothing indicating high concentrations that would warrant facility shut down.

Continuous, Real-Time Leak & Emissions Detection:
Although CH4 constituted a small portion of the geothermal well gas stream, the sensors were able to detect even small concentrations of CH4 during well flow tests. Additionally, the sensors detected CH4 events that did not necessarily originate from the facility, either from nearby sources via crosswind or from the village. The sensors were able to detect & log even small concentrations of CH4, which aligns with what NESR sees as forthcoming GHG reporting standards in Indonesia.
Dashboard Visualization & Programmable Device Alerts:
The client, along with other governmental observers, was able to engage interactively & remotely with the Qube Emissions Dashboard. The dashboard presented quantification of H2S and CH4 over time, which allowed users to analyze historical data over the duration of the pilot. Additionally, alarms were defined by the client to send email alerts via cell phone to key managers whenever H2S concentrations crossed established thresholds. These alarms were never triggered, but the H2S data correlated strongly with data from the alternative sensor technology deployed onsite.
Additional Value – Wind & Air Quality Data:
In addition, the client found historical wind & atmospheric data logging to be a helpful feature of the platform.
Learn more about Qube’s Continuous Emissions Monitoring Solution.