How Continuous Monitoring Caught Flare Combustion Issues That Temperature Monitoring Missed
A facility's flare was reading normal tip temperature, but continuous monitoring showed emissions climbing by 118% month over month. Here's how cross-referencing monitoring data with operational records traced the issue to a blower running without PID control and verified the fix.
Introduction
Standard flare monitoring relies heavily on temperature. A thermocouple reading within normal range is generally taken as confirmation that combustion is occurring and the flare is performing as expected. This case study examines what happens when that assumption is incomplete. Continuous emissions monitoring identified a month-over-month increase in flare emissions at a facility where tip temperature readings remained normal. Standard operational indicators alone would not have flagged the combustion efficiency problem behind it.
Emissions Detected: Month-Over-Month Trending in the Wrong Direction
Detection began when Qube's continuous monitoring system flagged elevated emissions at a tank and separator. Short-duration rate spikes triggered automated alarm notifications, putting the operations team on immediate alert. Over the following week, the 7-day rolling emission rate climbed toward the 15 kg/h regulatory screening threshold. If the threshold was crossed, it would trigger mandatory reporting obligations under EPA’s NSPS OOOOb/c. Without continuous monitoring in place, these early warning signs would have gone unnoticed until a scheduled manual inspection.
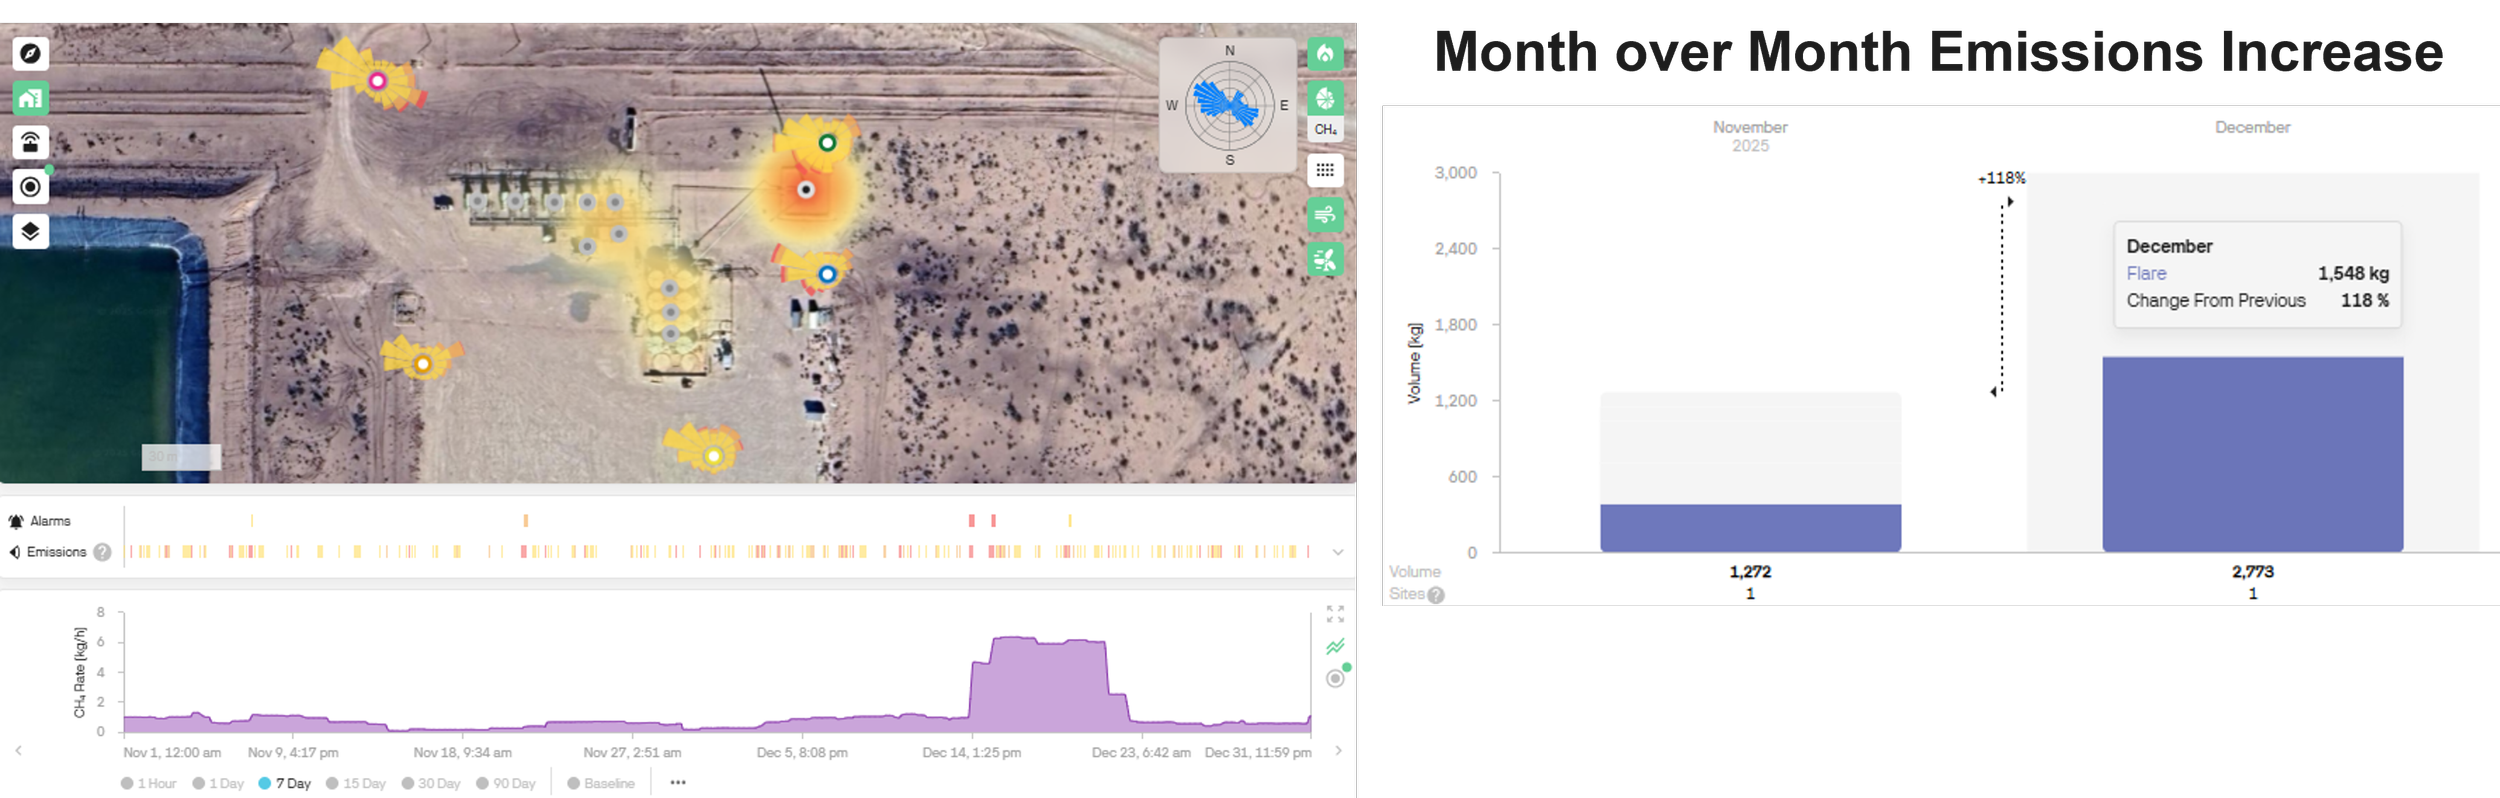
An image of the site on Qube’s platform (left panel). Five Qube Fenceline monitoring devices were deployed around the perimeter. Emissions were elevated above baseline levels and alarms were triggered to notify operations teams. Qube tracks the month-over-month emissions (right panel). Operators observed an 118% increase in flare emissions from November to December at this site.
The Investigation: Connecting Emissions to Operations
The team cross-referenced continuous monitoring data with operational records. A consistent pattern emerged: elevated emissions corresponded with periods of increased flaring activity, which were in turn linked to midstream downtime events. When the midstream system experienced downtime and more gas was routed to the flare, emissions rose. When flaring volumes returned to normal, emissions eased — but not back to prior baseline levels. That detail was significant. A volume-only explanation would have produced a clean return to baseline. The fact that it did not pointed to a combustion efficiency issue compounding the volume increase.
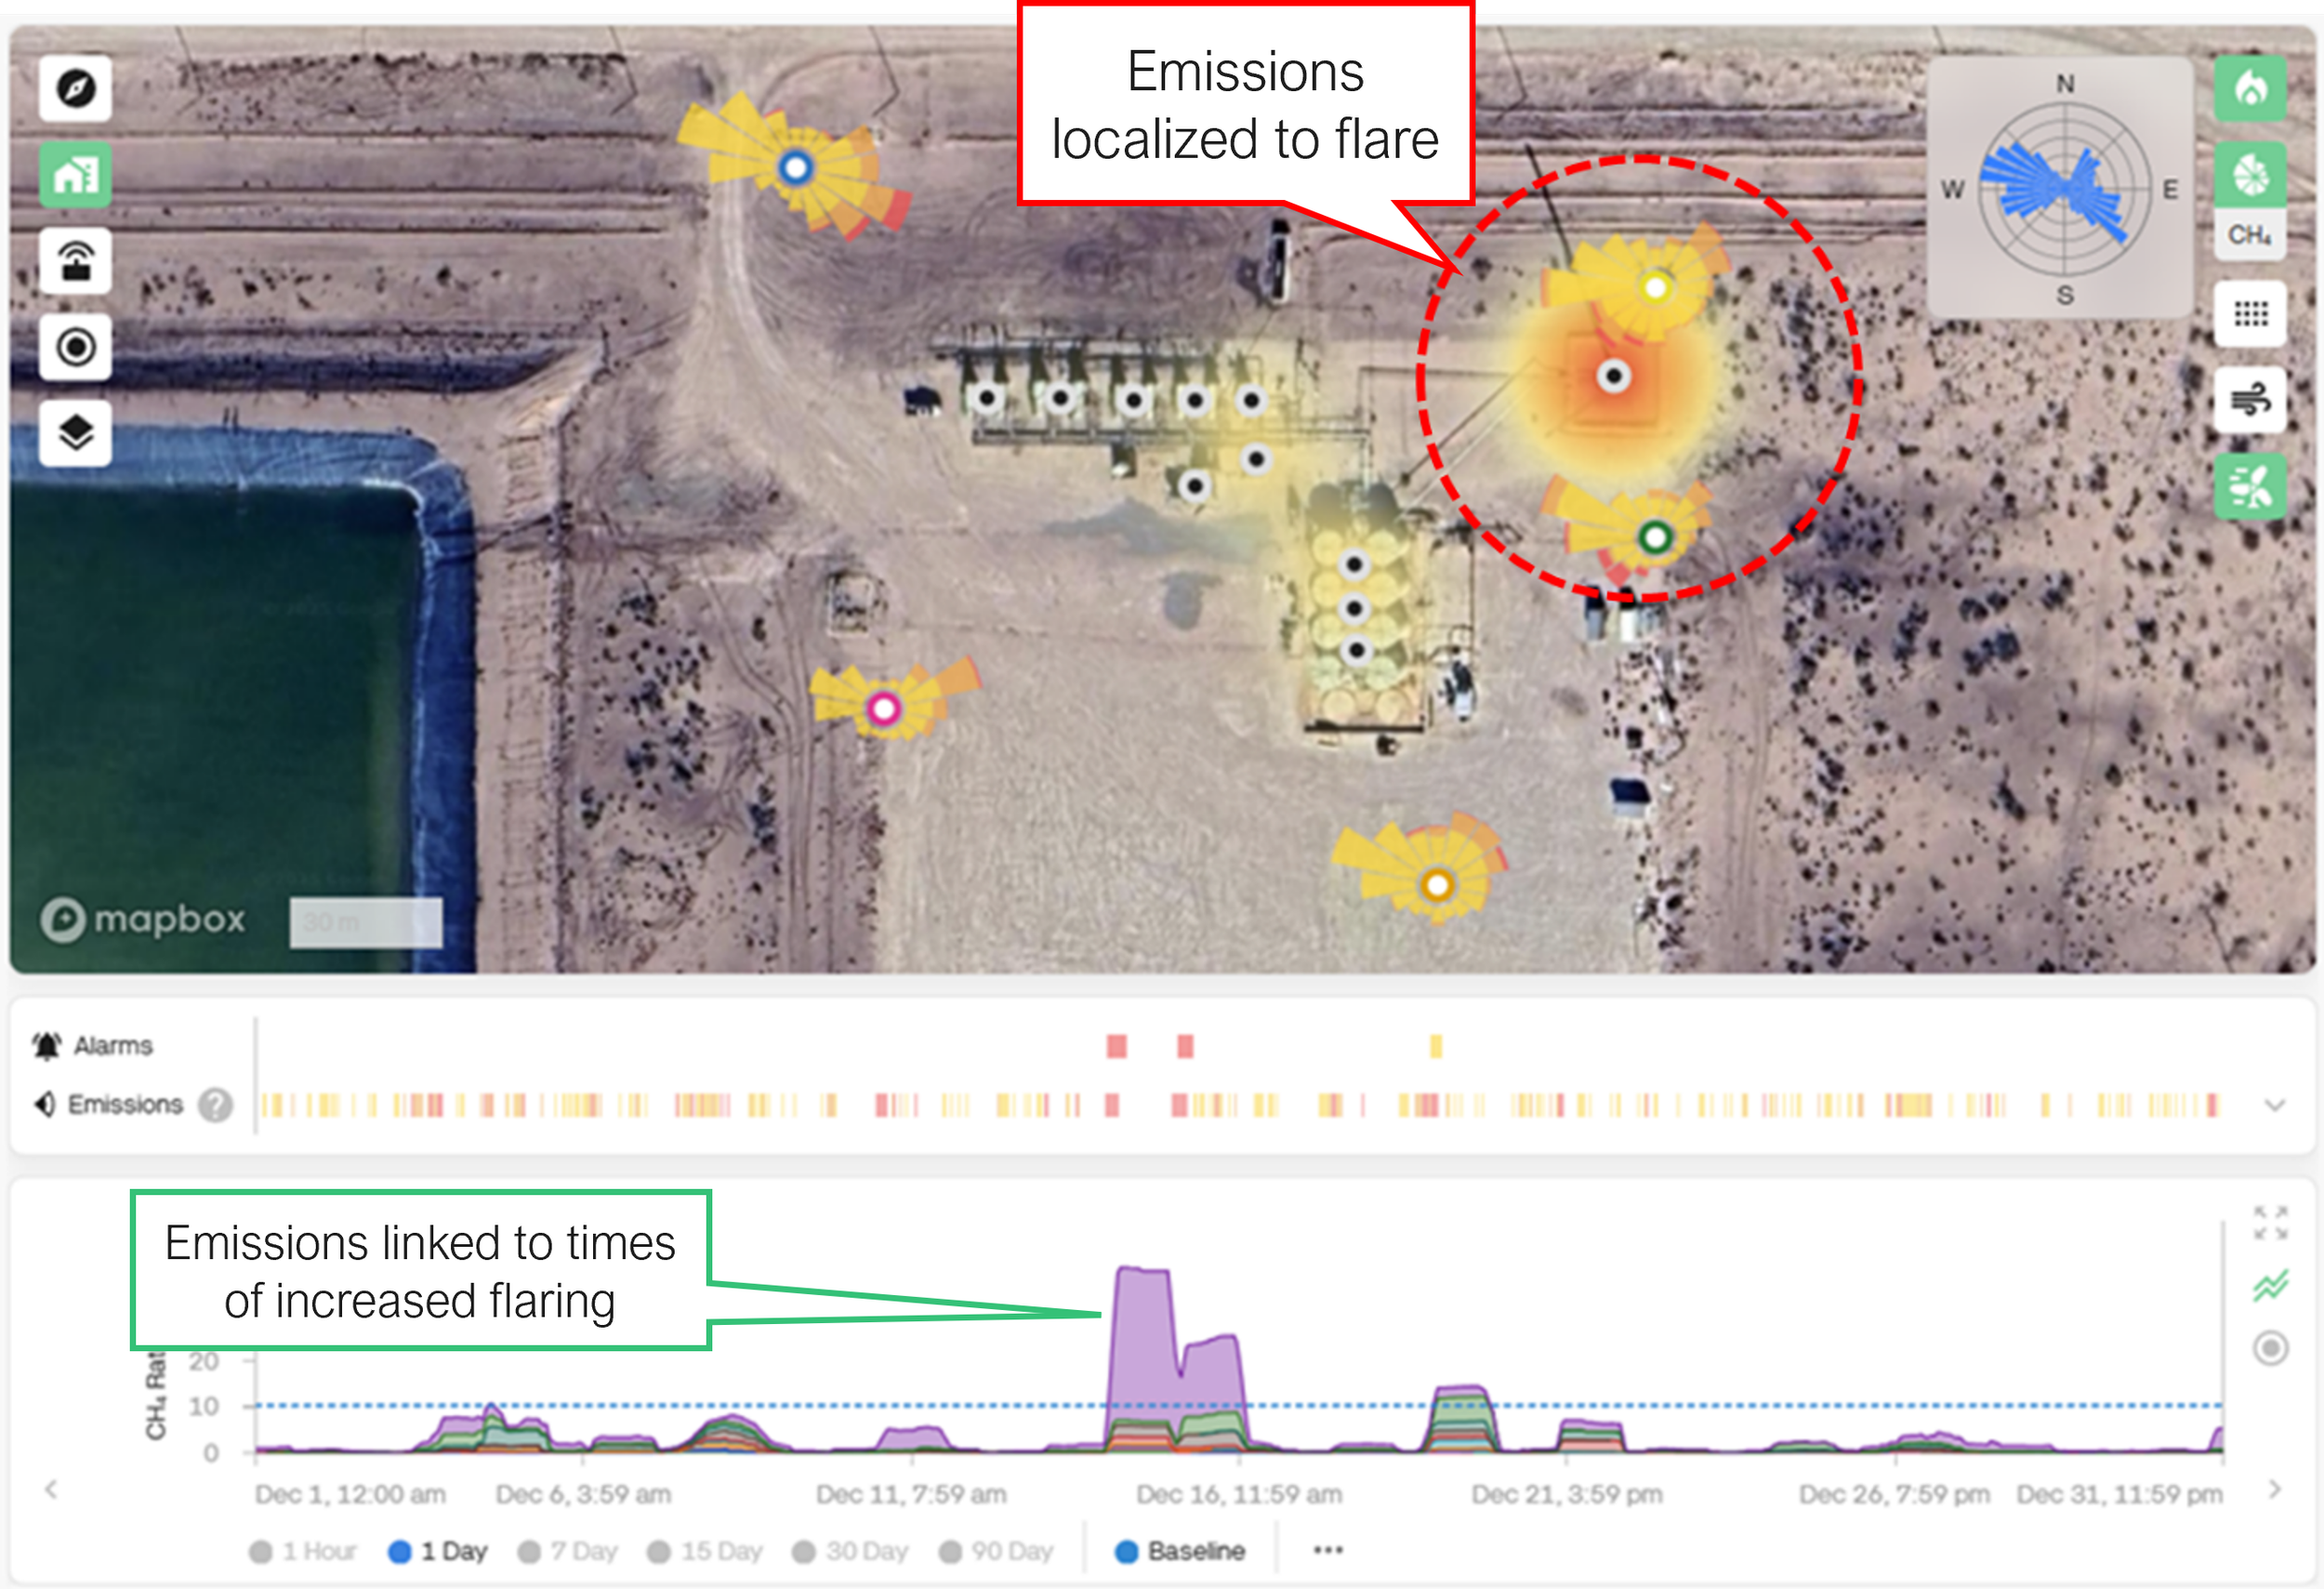
Emissions were localized to the flare region by Qube’s continuous monitoring. Continuous monitoring provides timing of emissions increases and the ability to correlate emissions events with operational activities. Here we see emissions spikes at times of increased flaring.
Root Cause: A Blower Without Feedback Control
The investigation identified that the flare blower was running at constant speed rather than being controlled by a PID (proportional-integral-derivative) controller. A PID-controlled blower adjusts its output continuously in response to changes in gas flow, maintaining the air-to-gas ratio required for complete combustion. Without PID control, the blower supplied the same volume of air regardless of how much gas was being flared. As flaring volumes increased during midstream downtime events, the fixed-speed blower fell behind, creating a fuel-rich combustion zone and producing methane slip at the flare tip. The flare tip temperature remained within range because combustion was still occurring, but only partially.
Outcome: Combustion Adjusted, Emissions Confirmed
Air-to-gas balance adjustments were completed on the flare. Following the adjustments, combustion performance improved and emissions decreased below the pre-event baseline. Monitoring provided ongoing confirmation that the changes had taken effect, closing the loop on the repair without waiting on a scheduled inspection.

We can see on the CH4 emissions graph the timing when operators were notified and verification of emissions dropping below the baseline following repairs.
Key Takeaway
Flare tip temperature confirms that combustion is happening. It does not confirm how well. A constant-speed blower operating outside its effective air-to-gas range during high-volume flaring periods can produce measurable methane slip while maintaining normal temperature readings. In this case, continuous emissions monitoring identified the performance gap, the investigation traced it to a specific control configuration, and the fix was verified with the same monitoring data that flagged it.
Interested in how Qube Technologies can help you reduce risk and operational costs across your asset base?
FAQs
-
A PID (proportional-integral-derivative) controller is an automated control system that continuously adjusts its output based on real-time feedback from the process it manages. In a flare system, a PID-controlled air blower adjusts fan speed in response to changes in gas flow volume, keeping the air-to-gas ratio within the range required for complete combustion. Without PID control, the blower runs at a fixed speed regardless of how much gas is being flared. When flaring volumes increase — as they do during midstream downtime events — a fixed-speed blower cannot compensate, and the combustion zone becomes fuel-rich. The result is incomplete combustion and methane slip at the flare tip.
-
Flare tip temperature confirms that combustion is occurring, but it does not measure how complete that combustion is. A flare can maintain normal thermocouple readings while still allowing a portion of the gas stream to pass through unburned, particularly when the air-to-gas ratio is off during high-flow periods. Temperature is a combustion presence indicator, not a combustion efficiency indicator. This is why temperature-based monitoring alone is not sufficient to verify flare performance under variable operating conditions.
-
Methane slip refers to uncombusted methane that passes through a combustion device without being oxidized. It occurs when combustion conditions — particularly the air-to-fuel ratio — fall outside the effective range. Methane slip at a flare means the facility is emitting methane it intended to destroy. Because methane is a potent greenhouse gas, even relatively small volumes of slip can represent a meaningful increase in a facility's emissions profile, and under emerging flare performance regulations, combustion efficiency requirements are becoming increasingly specific.
-
Midstream downtime refers to periods when a pipeline, gathering system, or processing facility is offline or operating at reduced capacity. When midstream infrastructure is unavailable, gas that would normally be gathered and processed needs an alternate route. Depending on facility design, it is often routed to the flare until the midstream system comes back online. This can cause flaring volumes to spike significantly during downtime events, placing higher demand on flare control systems. Without PID control, a fixed-speed blower cannot adjust to those volume increases, and combustion efficiency degrades as a result.
-
After the air-to-gas balance adjustments were completed, Qube's monitoring system provided near real-time confirmation that emissions had decreased below the pre-event baseline. This gave the operations team documented verification of the repair without requiring a scheduled follow-up inspection. Ongoing monitoring also means that any future drift in combustion performance — for example, during future midstream downtime events — will be detected early rather than accumulating month over month before it is identified.