Using Data to Optimize Detection Device Placement
Author: Everett Robinson, Mohsen Ghanavati, and Dave Levy
Emission rates, emission durations, and wind speeds all vary, which can impact a continuous monitoring system’s probability of detection. Qube has developed a solution that optimizes device placements to assure the highest levels of detection and value for customers.
Overview of Detection Device Placement in Continuous Monitoring Systems
Continuous monitoring (CM) systems work by detecting methane that is carried by wind from a given point in a facility to fixed sensors placed around the fence line. The number of sensors deployed, and the placement of those sensors, is typically based on the facility’s configuration and a detailed analysis of predominant wind directions to maximize the probability of detecting emissions from the facility.
Methane concentrations and environmental data captured by the sensors are uploaded to a cloud-based analytics platform where localization and quantification calculations are made. These outputs are then displayed in a web-based dashboard for operators to respond in accordance with the data.
Why is device placement important?
CM systems are highly cost effective because they can monitor a large area with minimal hardware. However, it is possible under certain wind conditions that CM detection devices can miss an emissions. For example, a narrow plume can slip between two devices, or wind can simply carry a plume in the opposite direction of where devices are placed. (image 1)

Image 1.
In a hypothetical site layout, wind carries a plume away from detection devices on the fenceline.
How Qube Determines and Optimizes Device Location
We can’t control the wind, but we do control where we place our devices. We can use wind data to inform where devices should be placed and maximize the system’s probability of detection without deploying additional hardware at an expense to customers. (Image 2)

Image 2.
Wind data is used to determine optimal device locations. Now, the Qube platform is in the best position to pick up the emission.
To accomplish this, Qube optimizes device placements by making statistical assumptions that the wind will vary in the future similarly to how it varied in the past. (Image 3)
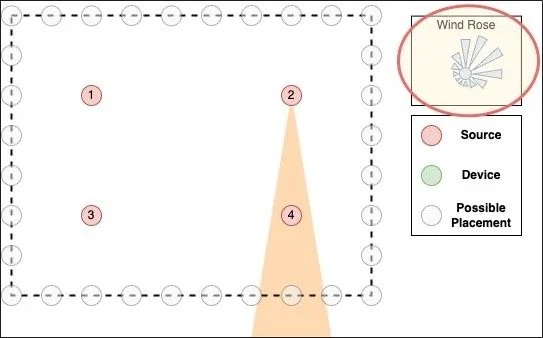
Image 3.
Historical wind data is used to predict future wind patterns.
We can therefore estimate if a device will observe an emission from a particular source when placed in a particular location and subject to prevailing winds, which is predicted using historical wind data. (Image 4)

Image 4.
Historical wind data is used to predict the behavior of an emission from a particular source.
We then choose the optimal subset of device placements from the potential locations in based on an operator’s device budget and emissions reduction goals. Our approach to device placement maximizes the probability that each potential emission source at a site is covered over time. (Image 5)

Image 5.
After determining wind patterns and the most likely sources of emissions, Qube places devices to maximize the probability of detection for each potential source over time.
In the dashboard, our device optimization tool enables operators to see how the location of devices may affect the percentage of emissions captured at a monitored site, and the projected effect of adding or subtracting devices to the total device budget.
Device Optimization Improves System Performance
We know that emission rates, emission durations, and wind speeds all vary. And we also know these factors can impact whether emissions concentrations will exceed our methane sensor detection thresholds. In response, Qube has developed a statistical solution that applies historical wind distribution patterns to models that reliably predict future wind patterns. We use these models to determine the optimal location of devices around a facility to assure the highest levels of detection, system performance, and value for customers.