
Expert Industry Insights
Get unique insights from Qube Technologies' experts to make better decisions and foster innovation.

Qube Release 2.40: New Site Baselines and Emission Rate Rolling Averages
The new Site Baselines feature helps you quickly identify over-emitting sites by comparing emissions to baselines set using various timeframes or EPA-compliant methods. The Emission Rate Rolling Averages tool provides deeper insights into trends with options from 1-hour to 90-day averages, improving your emissions monitoring over time.

Interrogating Emissions Using the Qube Platform
Qube’s platform provides continuous emissions monitoring, using wind data, gas concentration, and source identification algorithms to detect methane leaks. However, users must verify alerts, as the algorithm benefits from operational input to ensure accurate source identification.

Release 2.39: New Workflows, Emission Classification
Release 2.39 is now live, introducing the LDAR Workflow to effectively manage CH4 emission rate alarms by classifying emissions, assigning root causes, and tracking repair status directly in the Qube Dashboard. Additionally, users can utilize the Basic Workflow for other alarms to add comments and mark them as "Resolved," while classification data is easily accessible for analysis and export.
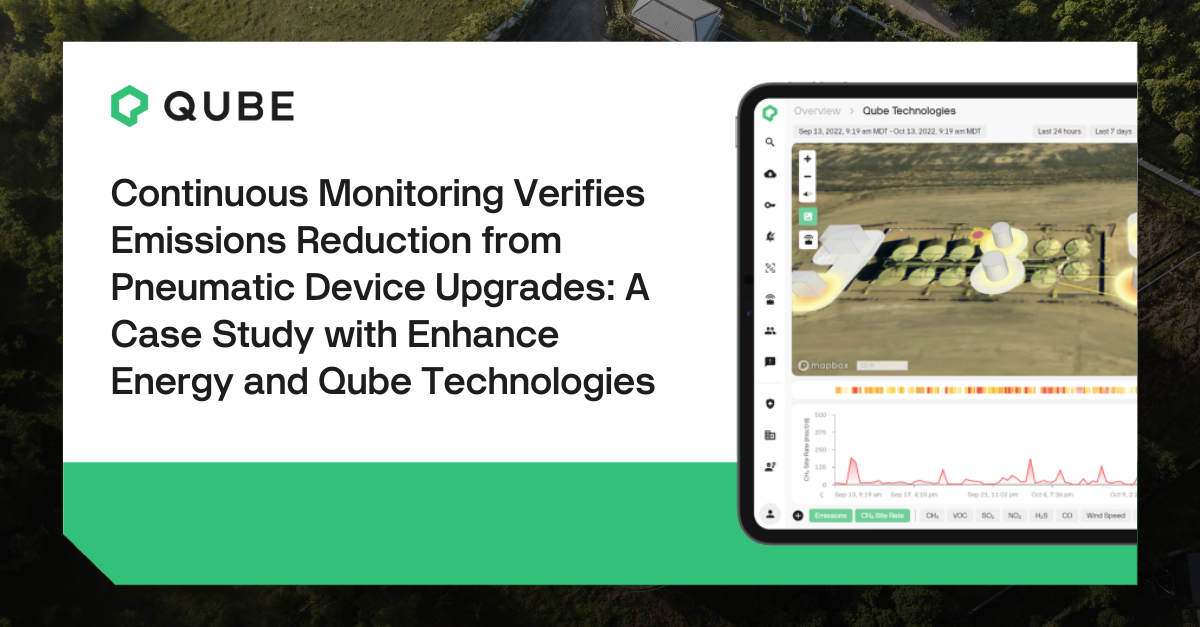
Continuous Monitoring Verifies Emissions Reduction from Pneumatic Device Upgrades: A Case Study with Enhance Energy and Qube Technologies
By upgrading high-bleed pneumatic devices to low-bleed controllers and implementing robust monitoring programs, operators can achieve significant reductions in methane emissions. These proactive measures are essential for complying with evolving regulations and minimizing environmental impact.

How Qube Technologies’ Methane Sensors Achieve Reliable Accuracy in Long-Term Deployments
This study reinforces a core value proposition of the Qube platform: minimal sensing hardware is required to accurately quantify methane emissions, and the devices remain reliable year after year in the field without manual intervention.

Using Continuous Monitoring to Detect Incomplete Combustion and Reduce Emissions
Qube deployed continuous monitoring devices with CH4 and CO sensors throughout a customer’s natural gas processing facility. The Qube sensors detected elevated emissions – specifically, increased CO concentrations – and reported this data to the customer via Qube’s dashboard.

Understanding Intermittent Emissions and How CM Technology Fills the Gaps
Emissions from oil and gas facilities are dynamic and often intermittent, meaning that standard measurement techniques may only capture a small portion of a facility's actual emissions. This is commonly known as intermittency, referring to the sporadic release of gases caused by operational changes or equipment issues.

How Continuous Monitoring Maximized the Value of Biogas for Roeslein Alternative Energy
This pilot showed that leaks do not occur at consistent intervals or emission rates. In fact, just 5% of the detected leaks represented ~55% of the total emissions over nine months of data collection. This distribution is similar to the oil and gas sector, where research has found that the top 5-10% of leaks represent 60-80% of emissions.

White Paper: Reducing methane emissions: Implementing data science informed operation and maintenance work practices using continuous monitoring technology (abstract)
Continuous monitoring technologies allow operators to implement novel operation and maintenance work practices to efficiently respond to methane emissions

Geothermal power plant emissions detection
One of the largest power producers in Indonesia implemented Qube‘s continuous monitoring solution to monitor for H2S gas at a new geothermal facility.