Qube Platform Release 2.58: Better Filtering, Simpler Event Creation
This release helps you focus on the emissions that matter, streamlines day-to-day workflows, and keeps alarm follow-up clear.
Filter CH4 sources on the rate chart
Filter devices across measurement charts
Streamlined workflow with clearer resolution fields
Bulk classify emission events
Click-and-drag event creation on the timeline
Delayed alarms included in the next-day email
Want to see how it works?
CH₄ Source Filtering
Focus on the sources that matter by filtering the CH4 Source Rate Chart.
Choose which sources to display so you can spot trends faster and investigate the right equipment.
How it works:
Select the Filter icon on the CH4 Rate chart
Pick one or more sources
The chart updates instantly to show only your selection
CH4 Source Filtering
Device Selection Across Each Measurement
Select devices you want once and view them across all charts.
Each measurement chart now supports device selection, so you can isolate the equipment you care about and keep every chart synced.
How it works:
Select devices from the map or directly on any measurement chart
All measurement charts update to match your selection
A badge indicates when the device filter is active.
Device selection on the site dashboard
Workflow Simplification
One streamlined workflow for fast, consistent closeout. LDAR and Basic workflows are now unified.
We’ve combined LDAR and Basic workflows into a single, simplified workflow so teams can resolve alarms consistently and move from detection to repair with fewer steps.
What’s changed?
A single workflow replaces LDAR and Basic streams
Alarms now include clear outcomes: Resolve or Repair Required
New Classification section standardizes how issues are categorized
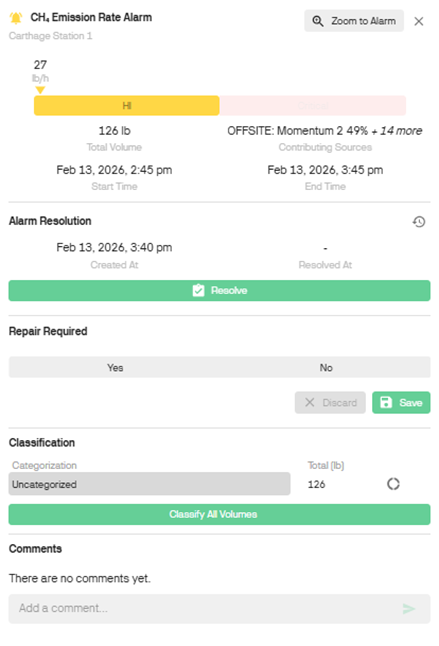
A single workflow combines the LDAR and Basic workflows for simpler records.
Bulk Emission Event Classification
Classify emissions with ease. You can now bulk classify emission events via the Event and Alarm slideouts.
How it works:
Choose the same root causes as previously listed, plus a new option ‘Ignore’.
You can still classify emissions by clicking on the emission event in the Emission Timeline.
Classify by using the ‘Classify’ icon beside the row of categorization, or by using the ‘Classify all volumes’ button.
Bulk emission classification via the Alarm slideout
Bulk emission classification via the Event slideout
Create Events by Click and Drag
Simpler event creation. Just click and drag.
How it works:
Event creation can now be accessed as a slideout
Click and drag across your duration of interest on the Event Timeline
A menu presents the choices ‘Zoom to Period’ or ‘Create Event’
Zoom to Period remains the same, the dashboard will zoom to the time selected
Create Event will open an event slideout for the time window selected, and the site already filled in, for easier creation of events
You can also edit an Event’s period by clicking and dragging (new icon within the ‘Edit Event’ slide out)
Create Events on the timeline. It’s as easy as clicking and dragging.
Included Delayed Alarms in Following Day Email
Delayed alarms are now in the following daily email and flagged as delayed.
Delayed alarms are indicated
Event creation can now be accessed as a slideout
Click and drag across your duration of interest on the Event Timeline
A menu presents the choices ‘Zoom to Period’ or ‘Create Event’
Zoom to Period remains the same, the dashboard will zoom to the time selected
Create Event will open an event slideout for the time window selected, and the site already filled in, for easier creation of events
You can also edit an Event’s period by clicking and dragging (new icon within the ‘Edit Event’ slide out)
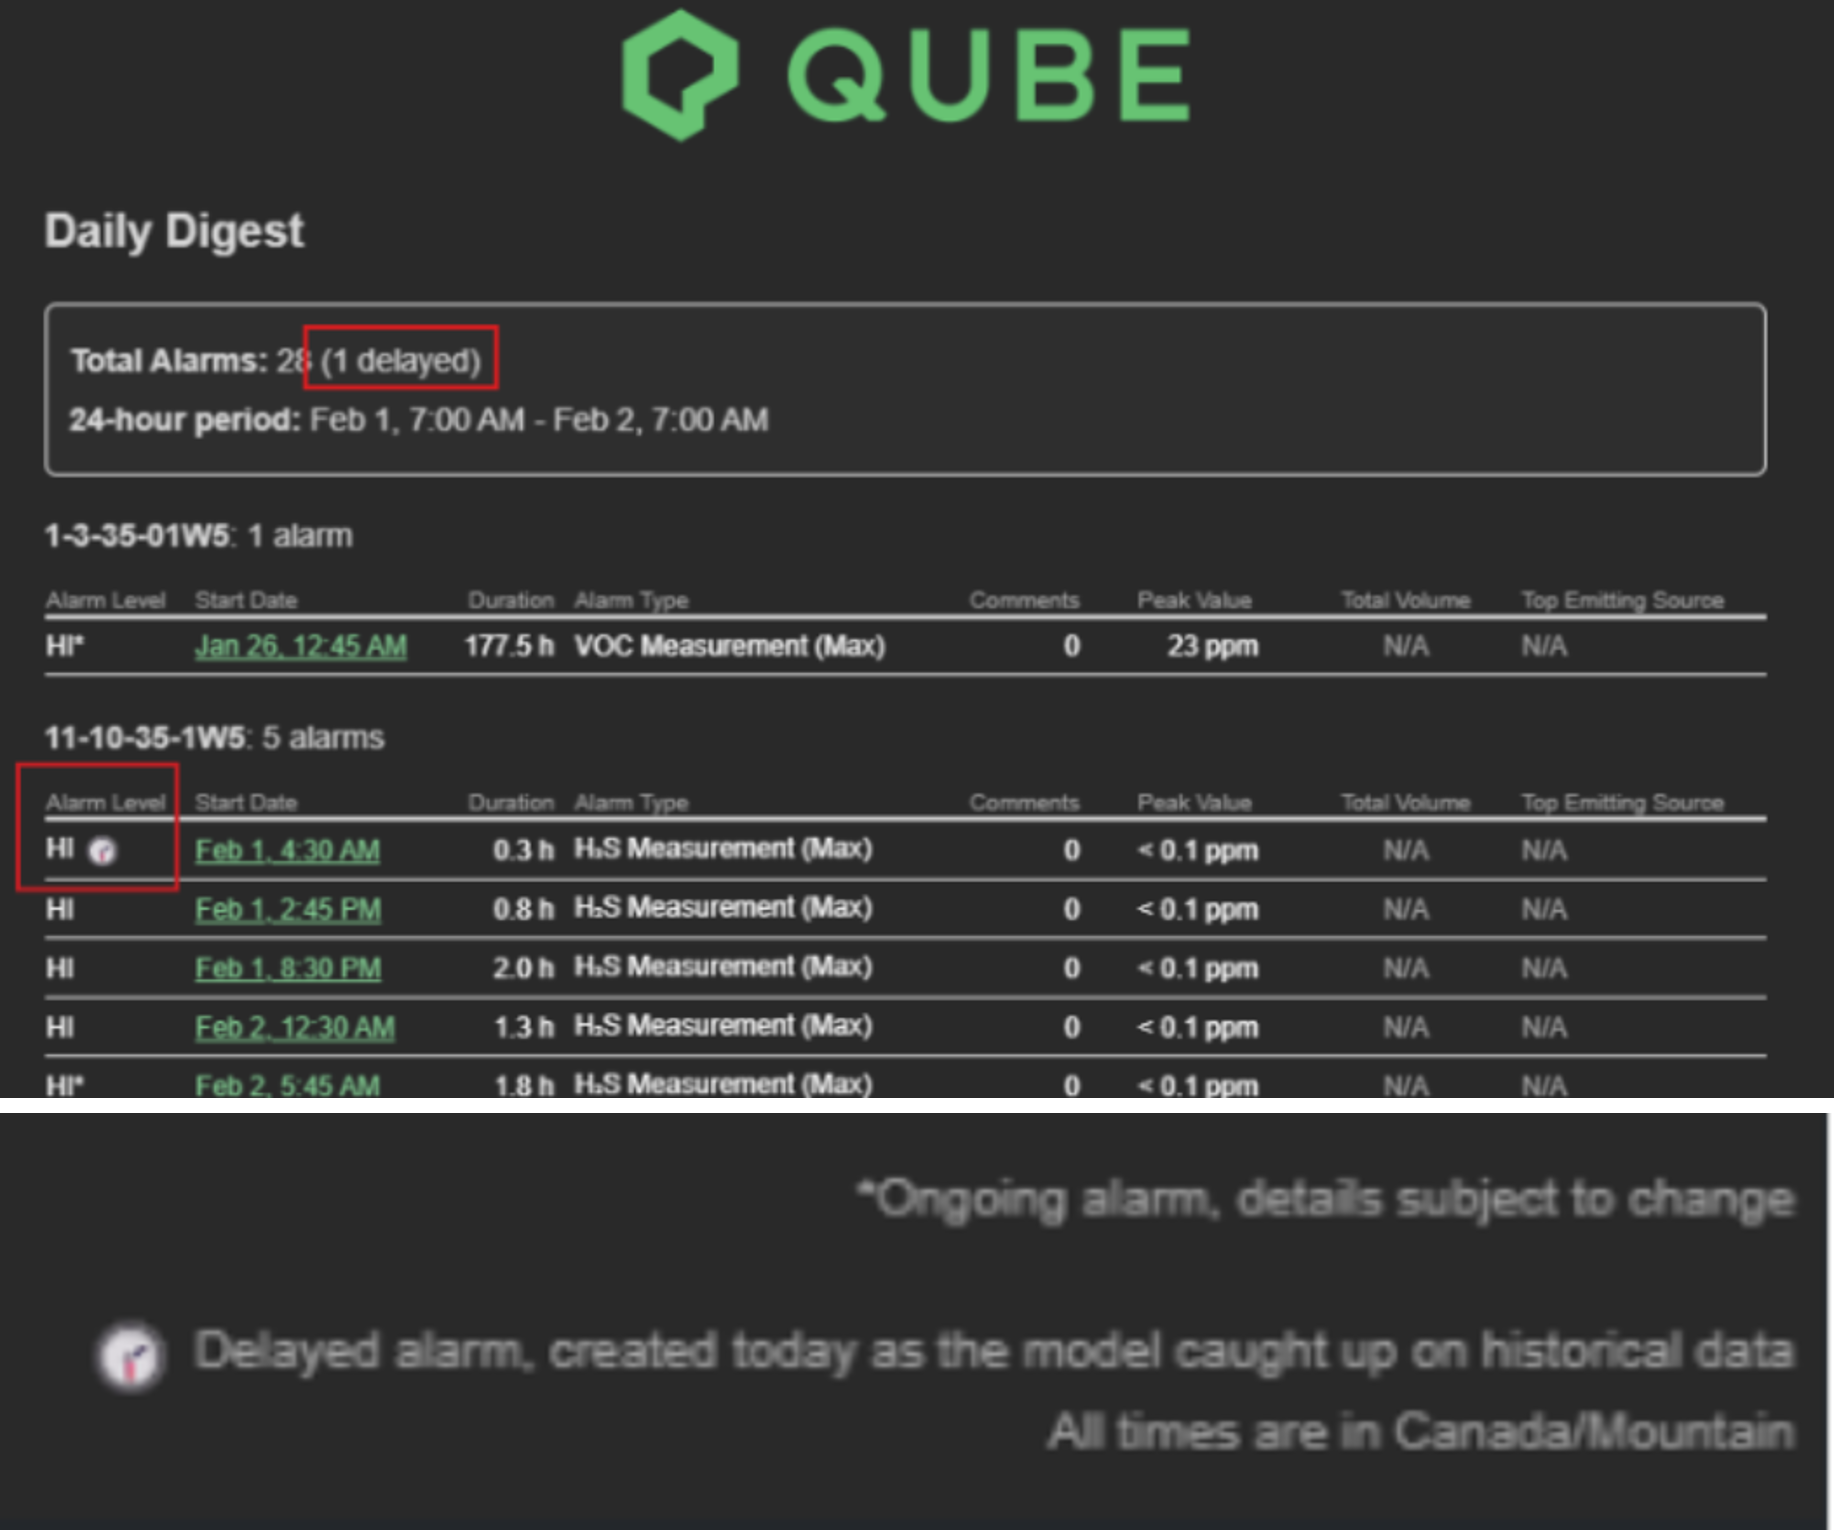
Delayed alarms included in the next day’s daily email.
If you’ve got any questions about these features or any Qube products, connect with our specialists at Qube Technologies.
For more insights into how Qube Technologies is driving emissions reduction, explore our expert insights, white papers, case studies or reach out directly.